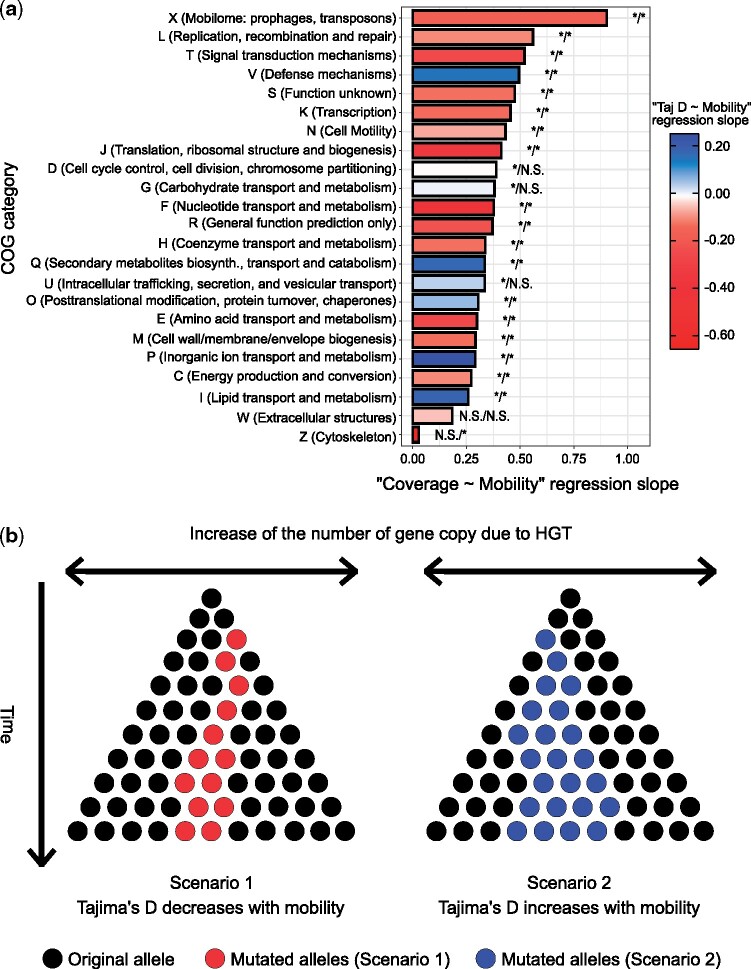
Fig. 5.
Gene mobility regressions reveal a minority of genes with distinct signals of selection. (a) Linear mixed model regression slopes per COG category. This figure illustrates COG categories regression slopes for the linear mixed models “” and “” with “” and “” being considered as random effects. The asterisks at the tip of each bar indicate the significance of the simple linear regressions “” and “,” respectively, for the associated COG category (*Significant; N.S., not significant; Cutoff: FDR-adjusted P < 0.05). (b) Schematic of evolutionary scenarios. Scenario 1 represents the situation in which mobile genes Tajima’s D is negatively correlated with gene mobility because HGT is faster than fixation of mutant alleles (red stars). Scenario 2 represents the situation in which Tajima’s D correlates positively with mobility. These genes maintain intermediate frequency mutations (blue stars) despite being frequently transferred to new species. Note that the gene copies (dots or stars) illustrated here could come from members of the same or different species in the microbiome.

