Fig. 1.
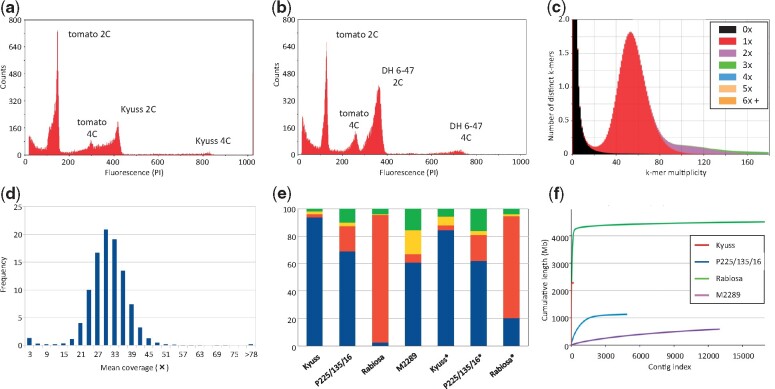
Features of the Kyuss genome and assembly. (a) Flow cytometry trace of Kyuss nuclei showing the occurrence of peaks at the same position as in the diploid parent (b) when compared with the tomato external standard. (c) KAT comp spectra describing the occurrence of mostly single-copy k-mers (red area) in the assembly under the main peak. The assembly is overall very complete (very small 0× area at multiplicities higher than 20) and the repeated sequences are correctly represented (purple and green enrichment values at multiples of the main peak). (d) Long-read coverage distribution upon read alignment. The lack of shoulders or additional peaks results entails the lack of collapsed or allelic regions in the assembly. (e) BUSCO analysis of the Kyuss and other public ryegrass assemblies (Byrne et al. 2015; Copetti et al. 2021; Knorst et al. 2019). Kyuss assembly shows the highest completeness in terms of conserved single-copy orthologs (SCOs), with only 4% of the models being fragmented or missing. The “Rabiosa” assembly is a diploid assembly, thus most of the SCOs are expected to be identified twice. The columns with the asterisk denote BUSCO scores for the predicted gene models. Blue: single copy, orange: duplicated, yellow: fragmented, green: missing models. (f) Total size and contiguity of the ryegrass assemblies evaluated by cumulative sequence length. The expected total size of the assemblies is around 2,500 − 2,700 Mb, except for Rabiosa where the diploid assembly should result in approximately 5,200 Mb. The high contiguity of the Kyuss assembly is denoted by the sharp vertical raise of the contig index approaching rapidly the total assembly size. In comparison, the “P226/135/16” and “M2289” assemblies show dramatically lower completeness and contiguity.

