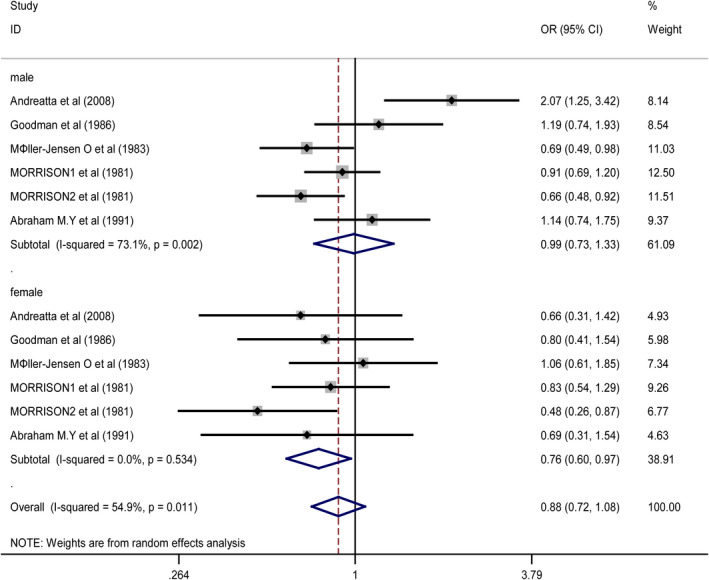
FIGURE 5.

Forest plot for the subgroup of gender. ORs of individual studies are indicated by the data markers; shaded boxes around data markers reflect the statistical weight of the study; 95% CIs are indicated by the error bars; OR with their 95% CI is depicted as a diamond
