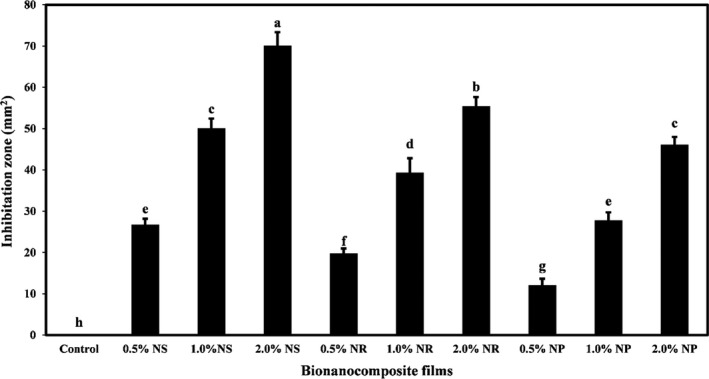
FIGURE 7.

The Escherichia coli growth inhabitation zone (mm2) of tapioca starch films containing different nano‐ZnO morphology. Bars represent mean (n = 3) ± SD. Different letters on the bars indicate a significant difference at 5% level of probability among starch films. NP, nanoparticle ZnO; NR, nanorod ZnO; NS, nanosphere ZnO
