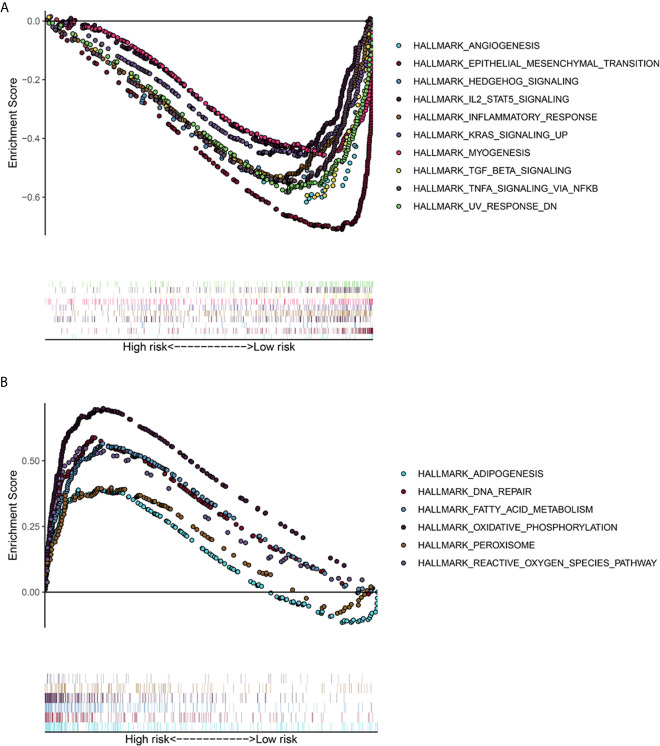
Figure 8.
The gene set enrichment analysis (GSEA) of ADAMTS9. (A) GSEA showed that the samples with high ADAMTS9 expression. The gene sets with P < 0.05 and FDR < 0.25 were regarded as significantly enriched gene sets. (B) GSEA showed that the samples with low ADAMTS9 expression. The gene sets with P < 0.05 and FDR < 0.25 were regarded as significantly enriched gene sets. FDR, false discovery rate.

