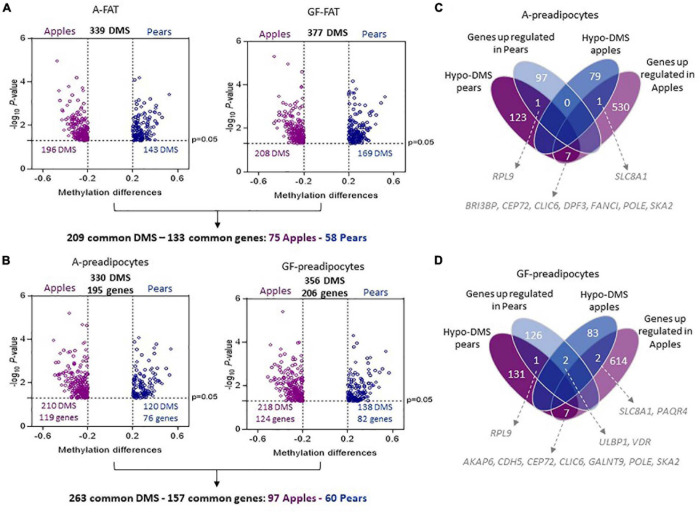
FIGURE 1.
Differentially methylated sites between apple and pear-shaped women in A-FAT and GF-FAT. (A,B) Volcano plot showing differences in DNA methylation between 10 apple and 7 pear-shaped subjects in A- FAT (A-left side), GF-FAT (A-right side), A-preadipocytes (B-left side), and GF-preadipocytes (B-right side). Each point represents a CpG site significantly differentially methylated with a β-value difference between both groups (methylation difference Apples vs. Pears) superior to 0.2. Purple color represents the sites more methylated in Apples. Blue color represents the sites more methylated in Pears. (C,D) The Venn diagrams represent the number of differential expressed genes and methylated sites between 10 apples and 7 pears women in A-preadipocytes (C) and GF-preadipocytes (D).

