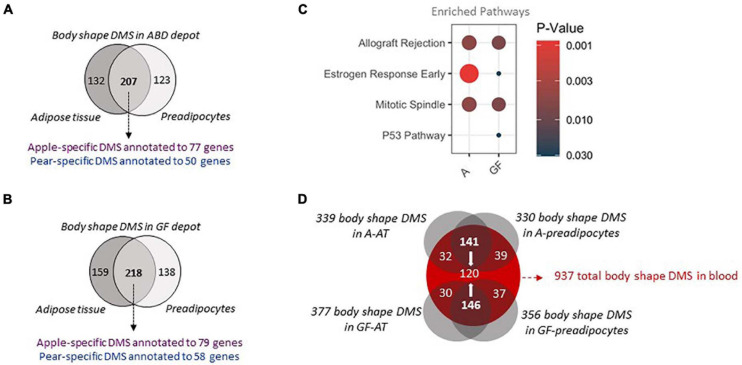
FIGURE 2.
Shared body shape differentially methylated sites between adipose tissue, cultured preadipocytes and whole blood (A,B). The 2 Venn diagrams depict the differentially methylated sites between 10 apple and 7 pear-shaped subjects in A (A) and GF (B) depot only in adipose tissue, only in preadipocytes or in both. Purple color depicts the number of unique genes annotated to sites hypermethylated in apple-shaped women. Blue color depicts the number of unique genes annotated to sites hypermethylated in pear-shaped women. (C) Pathway Analysis of the genes nearest the body shape specific DMS in A depot (A) and GF depot (GF). Only the common genes between whole tissue and cells were used. The size of the dots represents gene count. Only pathways with p-value < 0.05 are represented. (D) The Venn diagram depicts the common body shape DMS between adipose tissue, preadipocytes and blood for the 17 subjects. A = Abdominal, GF = Gluteo-femoral, DMS = Differentially Methylated Site.

