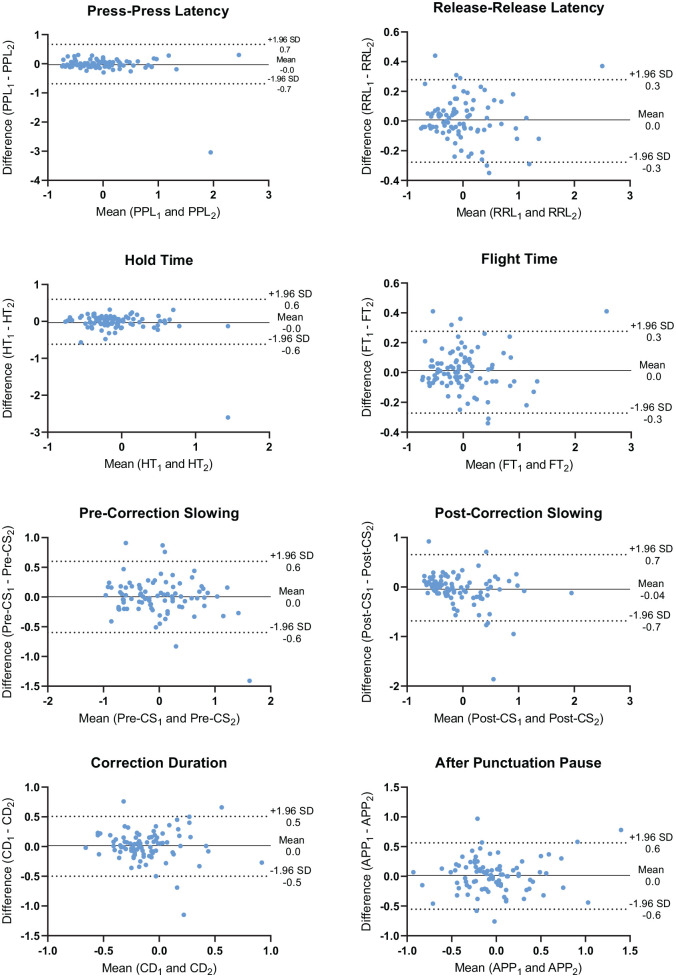
Figure 2.
Bland–Altman plots of the keystroke features between the test–retest period. Between the test and retest period, the difference was plotted against the mean for each keystroke feature. The solid line represents the mean difference (systematic error) in keystroke features between the test–retest period, and the two dotted lines represent the 95% limits of agreement (random error).

