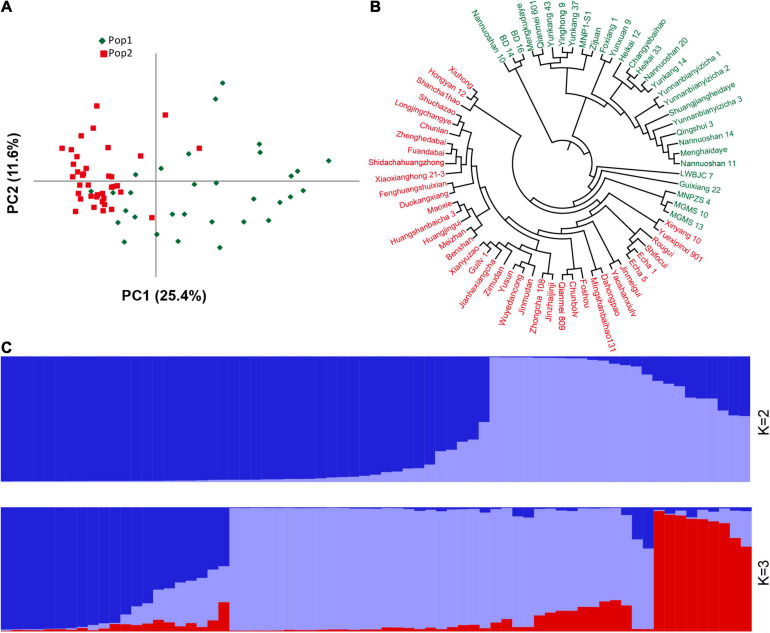
FIGURE 6.
Population structure and phylogenetic analyses of 69 germplasm samples based on the newly developed indel markers. (A) PCA analysis. (B) UPGMA phylogenetic tree. (C) Population stratification. For (A-B), green represents Pop1, red represents Pop2, and for (C), different colors represent different population stratification.

