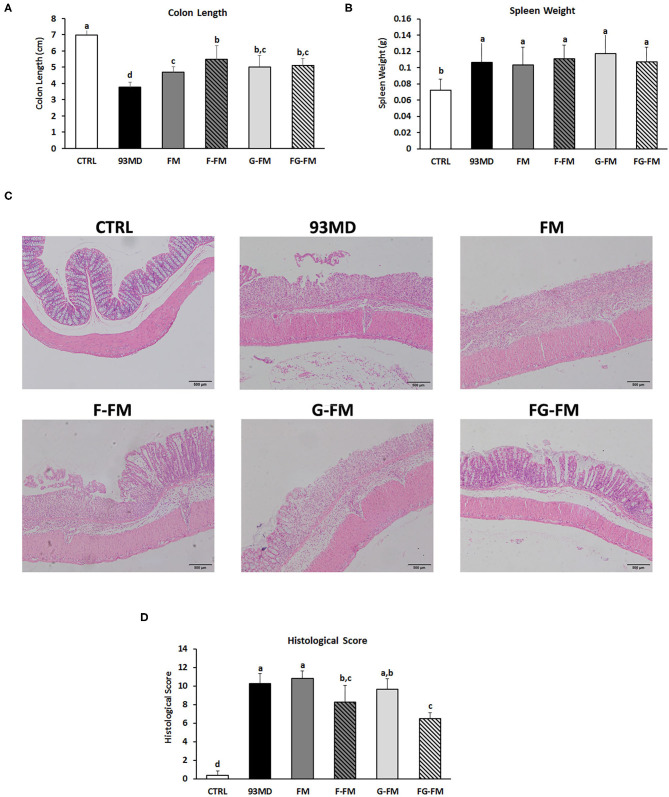
Figure 3.
Pathological and histopathological characteristics in different groups: (A) lengths of colon from different diet groups; (B) spleen weights of the different groups; (C) histological analysis and (D) histological severity scores of the different treatment mice. Comparisons of various anatomical measurements among six groups using one-way analysis of variance (ANOVA), followed by Fisher's LSD post hoc tests. Data are expressed as the mean ± SD. Bars with the same letter indicate a non-significant difference (P > 0.05). Sample size: n = 7 in 93MD group, n = 10 in other groups.

