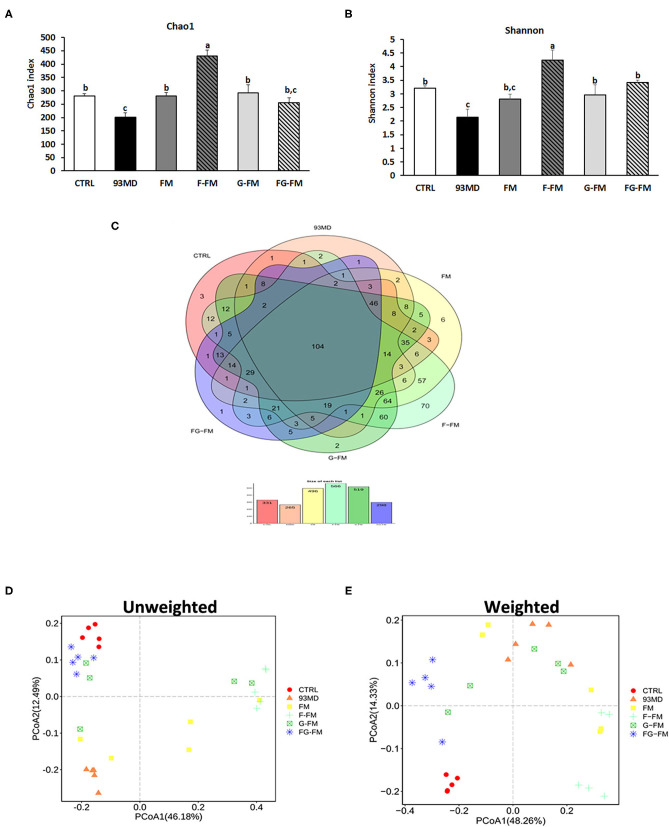
Figure 4.
Microbiota diversity indices of the different groups: (A) the bacterial richness of microbiota communities estimated by the Chao1 value. (B) The bacterial diversity of the microbiota communities estimated by the Shannon index; (C) Venn diagrams that illustrated the observed overlap of OTUs; (D) PCoA plot of unweighted UniFrac distance values and (E) weighted UniFrac distance values. All groups of α diversity indices (Chao1 and Shannon) were analyzed by one-way analysis of variance (ANOVA) followed by Fisher's LSD post hoc tests. Bars with the same letter indicate a non-significant difference (P > 0.05). Five samples per group were randomly selected for microbiota analysis.

