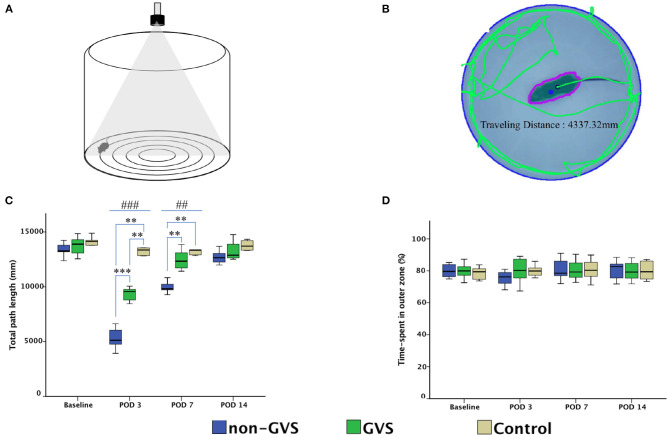
Figure 2.
Evaluation of the locomotor activities of mice through an open field task. The open field apparatus with an overhead camera and lighting support system (A). The recorded images were processed with the digital video-based tracking system using an image subtraction technique: the green lines indicate the total path length (B). GVS improved the total path length during the acute phase and there are significant differences between the three groups at post-operative day (POD) 3 (χ2 = 17.46, p < 0.001, Kruskal–Wallis test) and POD 7 (χ2 = 14.43, p < 0.01, Kruskal–Wallis test) (C). The percentage of time spent in the outer zone, which is an indicator of the anxiety assessment, was not different between the three groups (D). *, significantly different between two groups; #, significantly different between three groups; **, ## indicate p < 0.01; ***, ### indicate p < 0.001.

