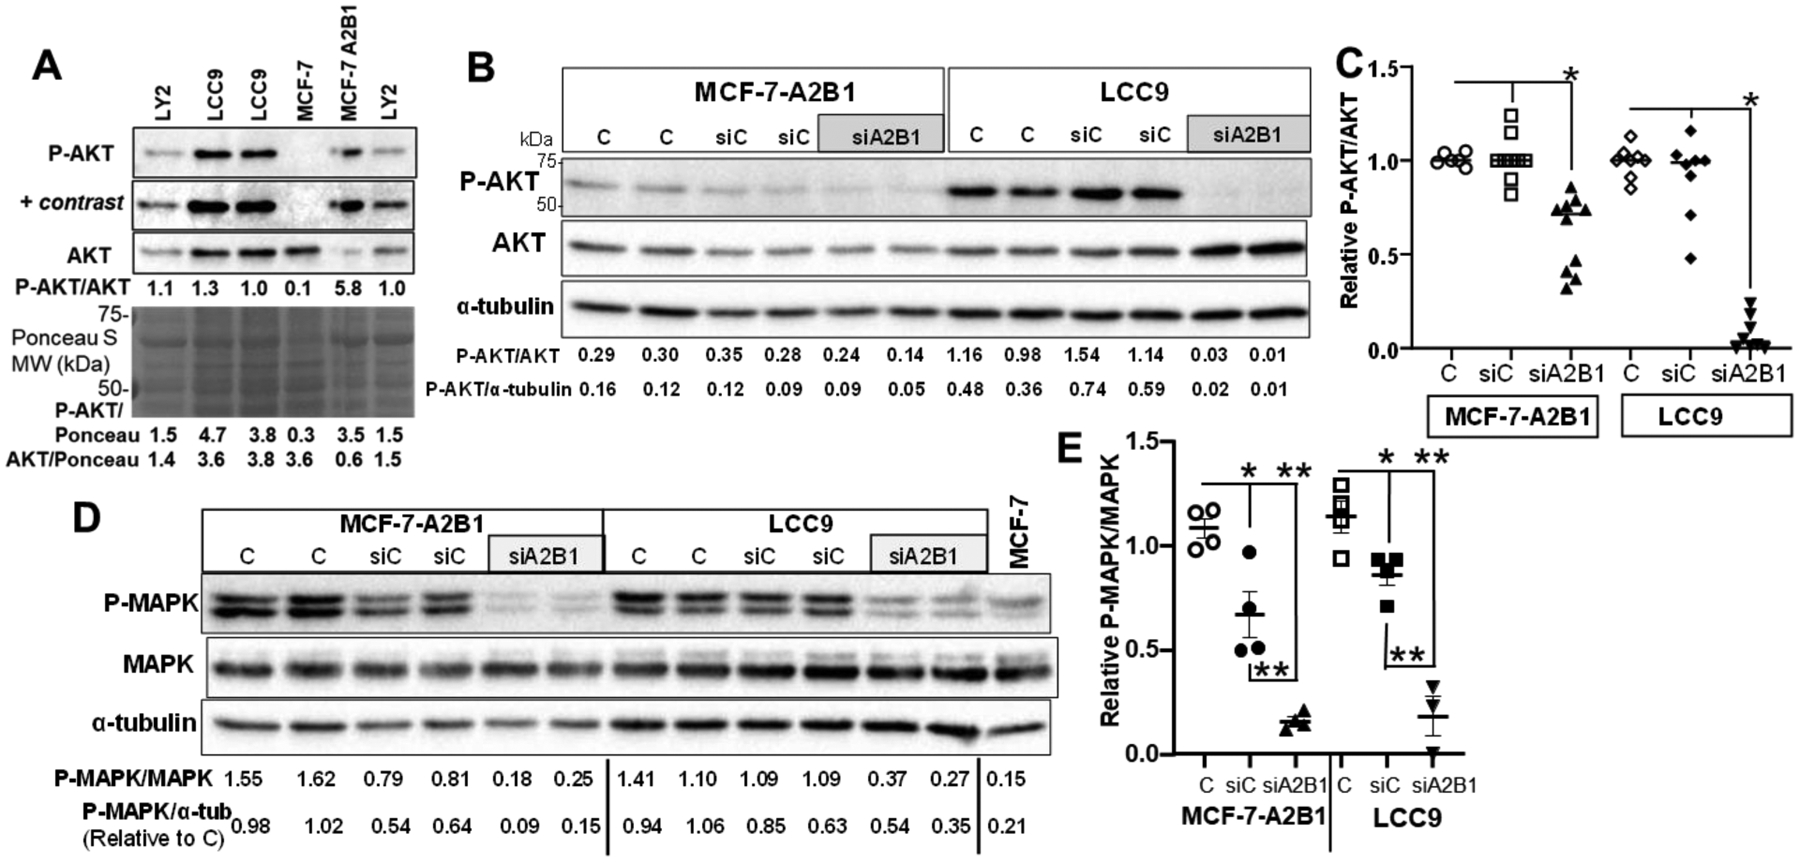
Figure 10: AKT and MAPK activation in MCF-7-A2B1 and LCC9 cells.

A) Western blot of phospho-ser-473 AKT/AKT/Ponceau S in the indicated cells grown in regular medium. + contrast indicates that the image was adjusted using ‘auto-contrast’ in Adobe Photoshop. B-D) MCF-7-A2B1 and LCC9 cells were transfected with siControl (siC) or siHNRNPA2B1 (siA2B1) in OPTI-MEM 48 h and then grown in 5% DCC-FBS medium for an additional 24 h prior to isolation of WCE for western blotting. Non-transfected cells grown in parallel, including medium changes are Control (C). For B and D) Values of the ratio of P-AKT/AKT, P-AKT/α-tubulin, P-MAPK/MAPK, or P-MAPK α-tubulin are shown for each blot. C and E) The P-AKT/AKT or P-MAPK/MAPK ratios for control cells in each cell line was set to 1 within each experiment. Data are from 3 separate experiments. E) * P < 0.001 from C and siC. E) * P < 0.01 and ** P < 0.001 versus C or siC, as indicated. Statistical analysis: one-way ANOVA followed by Tukey’s multiple comparisons test.
