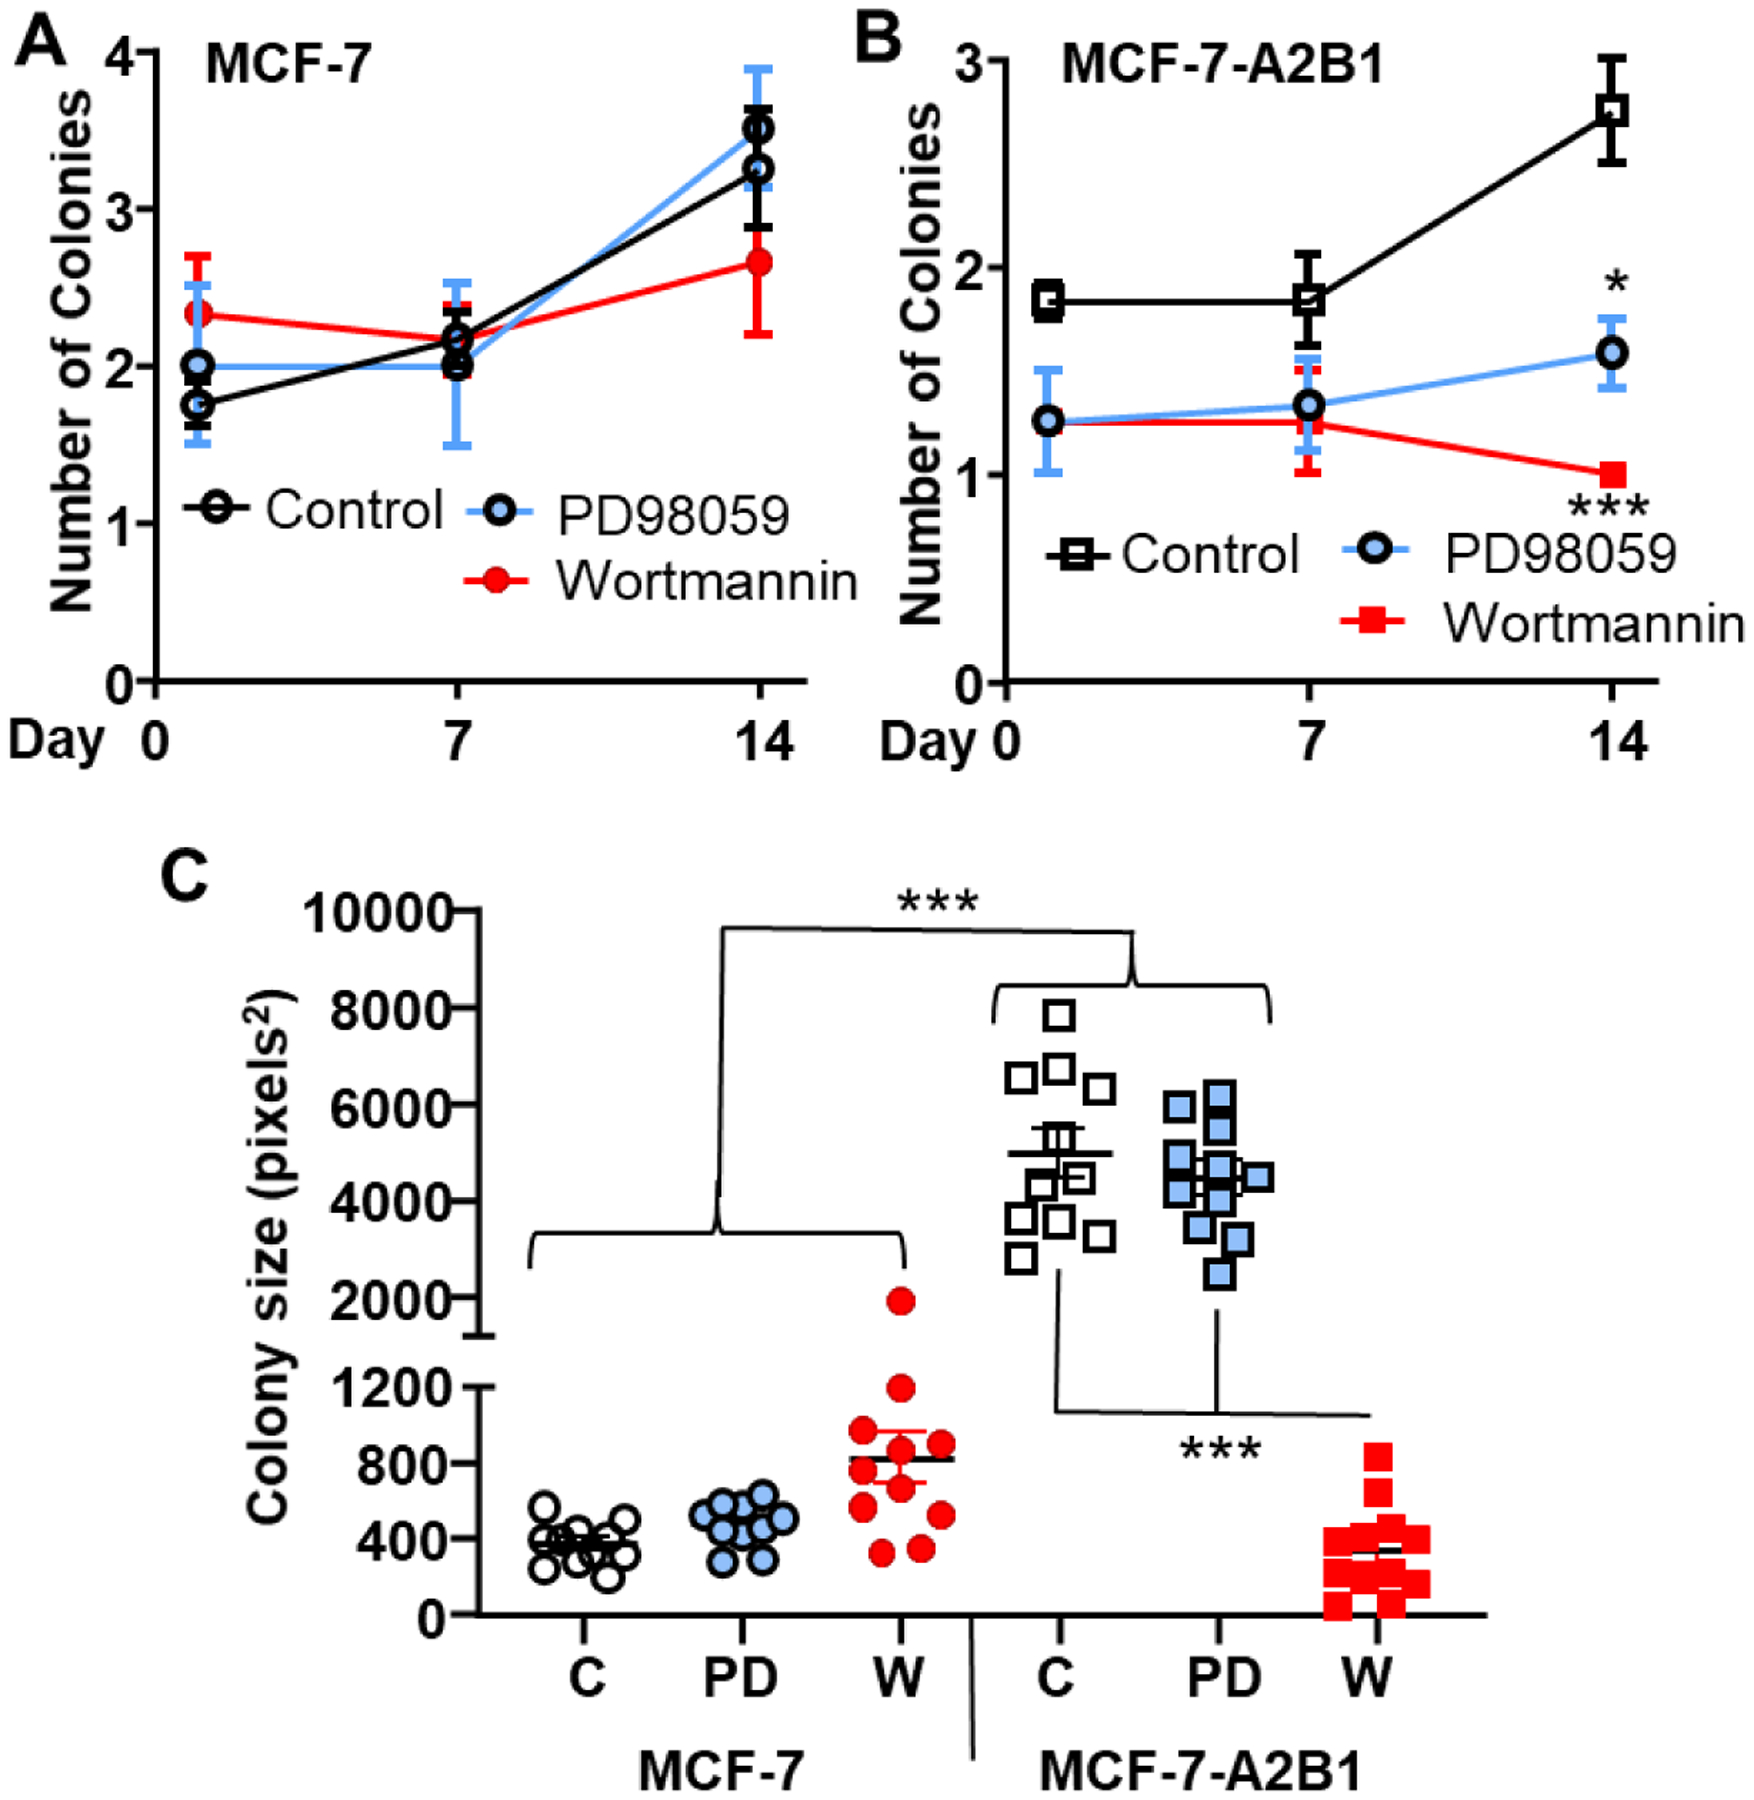
Figure 11: Inhibition of MEK and PI3K activity attenuates MCF-7-A2B1 soft agar colony growth.

MCF-7 and MCF-7-A2B1 stable cells were treated with vehicle control (EtOH, C), 50 μM PD98059, or 100 nM wortmannin and plated 50,000 cells/60mm plate. The medium, with respective treatment, was replenished every 4 d. Cell images were captured and analyzed after 1, 7, and 14 d. Average ± SEM values from 3 replicate plates are plotted (A and B) for the number of colonies counted. Data were analyzed by one-way ANOVA followed by Tukey’s multiple comparison test * p < 0.05, ***P < 0.001 compared to the control-treated cells on the same day. C) Mean individual colony size values at 14 d ± SEM. Data were analyzed by one-way ANOVA followed by Tukey’s post hoc multiple comparison test, ***p < 0.0001.
