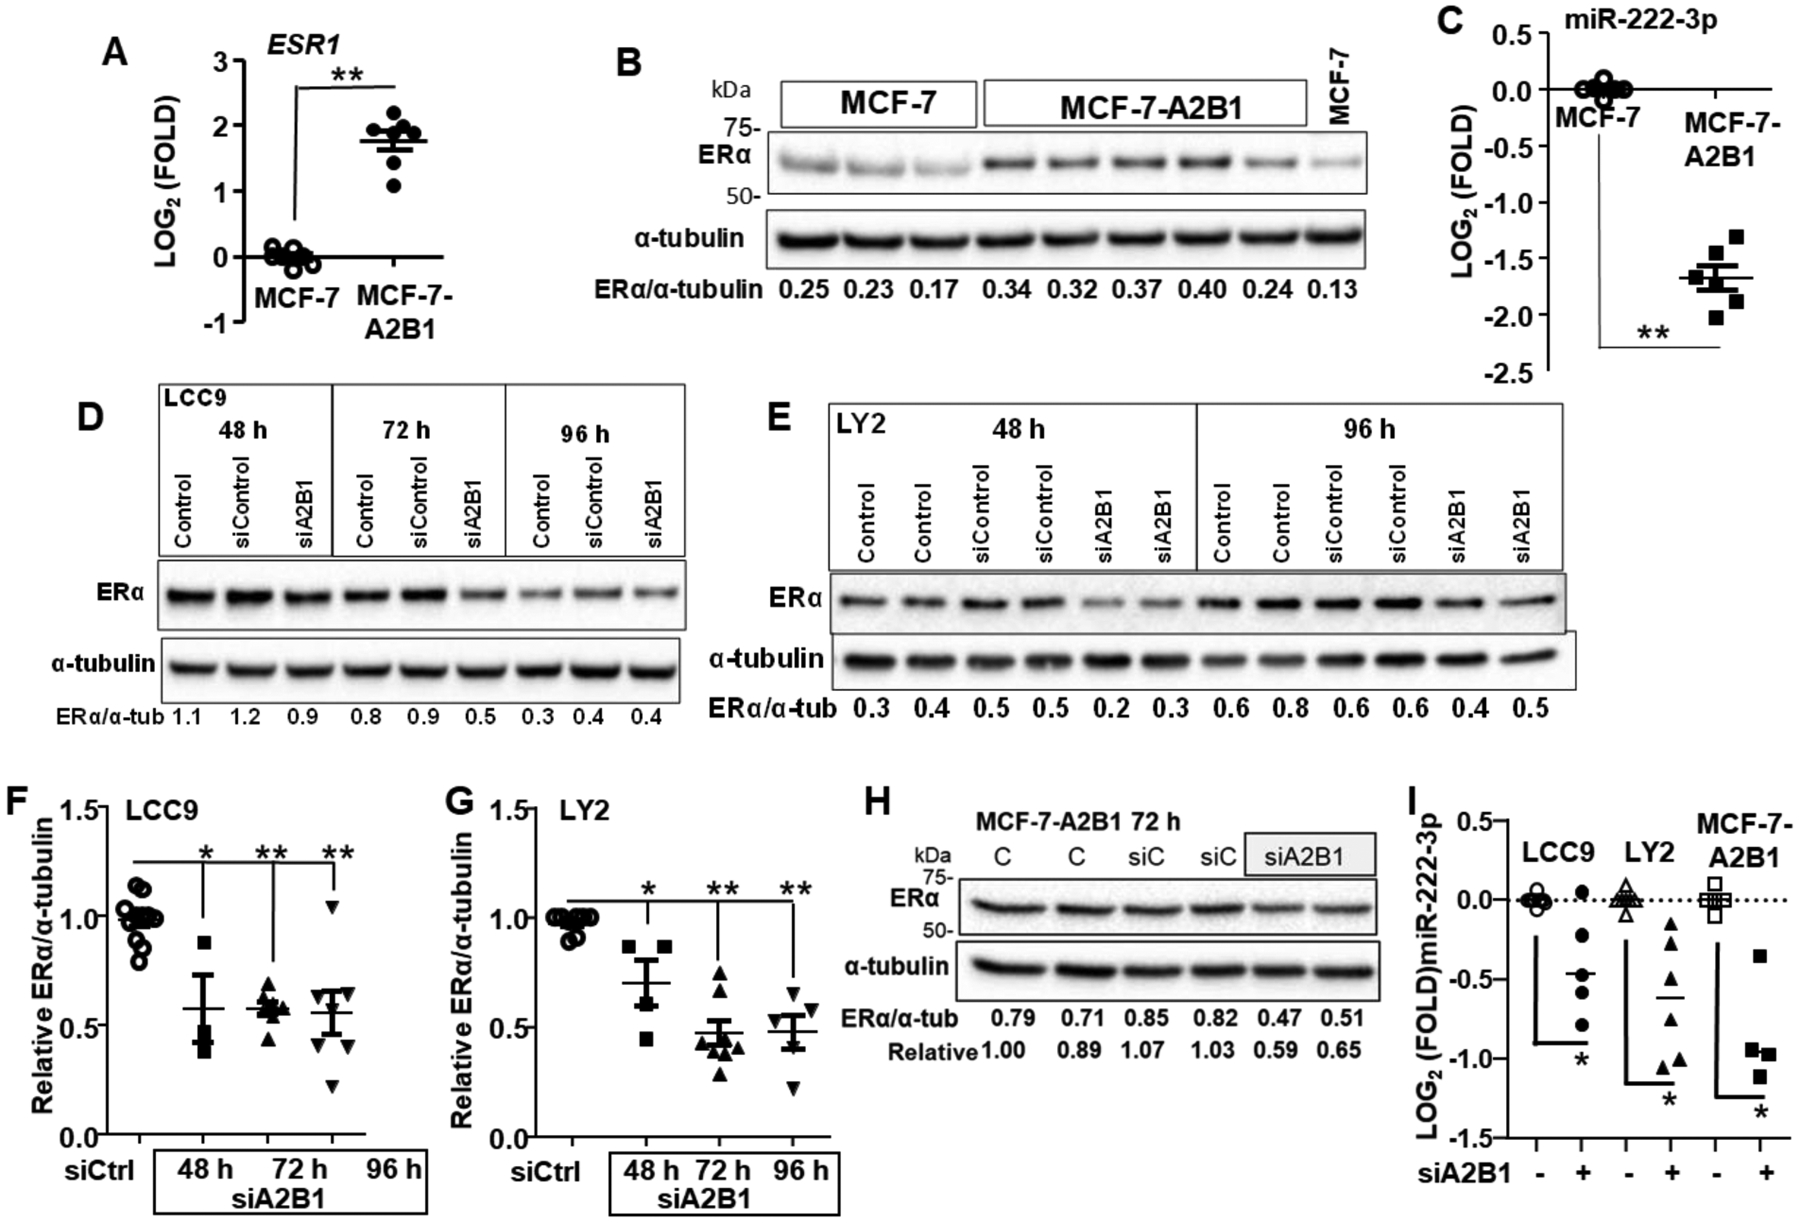
Figure 12: ERα is increased in MCF-7-A2B1 cells and siA2B1 reduces ERα in LCC9, LY2, and MCF-7-A2B1 cells.

A) Data are qPCR of ESR1 relative to GAPDH and normalized to MCF-7 control cells. Values are from 8 (A) separate miRNA extractions. ** p < 0.001 in a two-tailed Student’s t-test. For B, D, E, and H WCE were isolated from the indicated cell lines. Cells were not transfected (B or Control (C) in panels D,E, and H) or transfected with siControl, siA2B1 for the indicated amount of time. The blots were probed for ERα, then stripped and re-probed for α–tubulin for normalization. Representative blots are shown. Data F and G) are summarized from biological replicate ERα westerns with different cell lysates from 3–4 separate transfection experiments/cell line. ERα/α-tubulin were normalized to siControl (set to 1) in each experiment for comparisons between separate western blots (Relative ERα). *P < 0.05, **P < 0.001 vs. siControl in a one-way ANOVA followed by Tukey’s post hoc test. C and I) qPCR of MIR221–3p relative to SNORD48 and normalized to control cells. For I, the cells were transfected with siControl or siHNRNPA2B1 for 72 h prior to miRNA extraction and qPCR. *P < 0.0025 vs. siControl in a one-way ANOVA followed by Tukey’s post hoc test.
