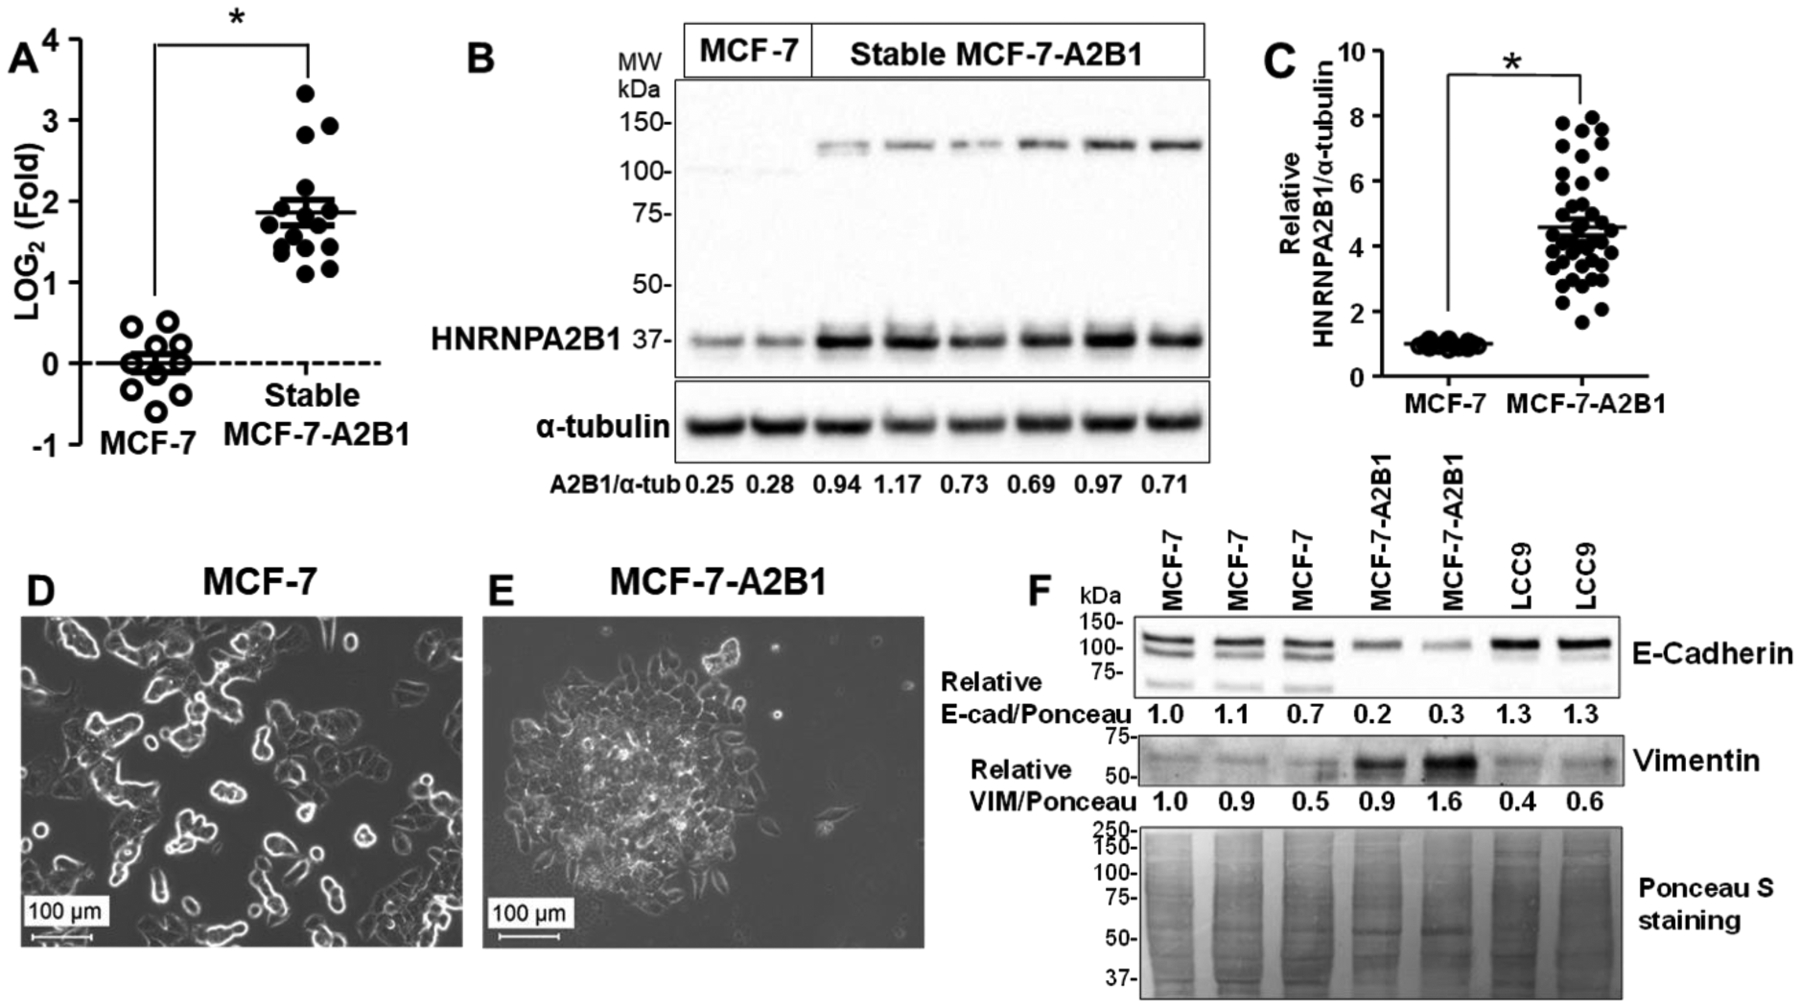
Figure 2: Stable overexpression of HNRNPA2B1 (A2B1) in MCF-7 cells.

A2B1 transcript (A) and protein (B and C) levels were measured in the G418-selected MCF-7-A2B1 cells and MCF-7 cells. GAPDH and α-tubulin were was used as a normalization controls for qPCR and western blots respectively. C) Summary of 16 separate western blots, each with 3–8 separate preparations of WCE. *p < 0.0001, Student’s two tailed t-test. Phase contrast images of MCF-7 (D) and MCF-7-A2B1 cells (E) at 20X phase contrast imaging, scale bar = 100 μm (additional images in Supplementary Figure 4). F) Representative western blot showing E-cadherin and vimentin in WCE from the indicated cell lines. Quantification is relative to Ponceau S staining with the MCF-7 sample in the first lane set to 1.0 for relative quantification.
