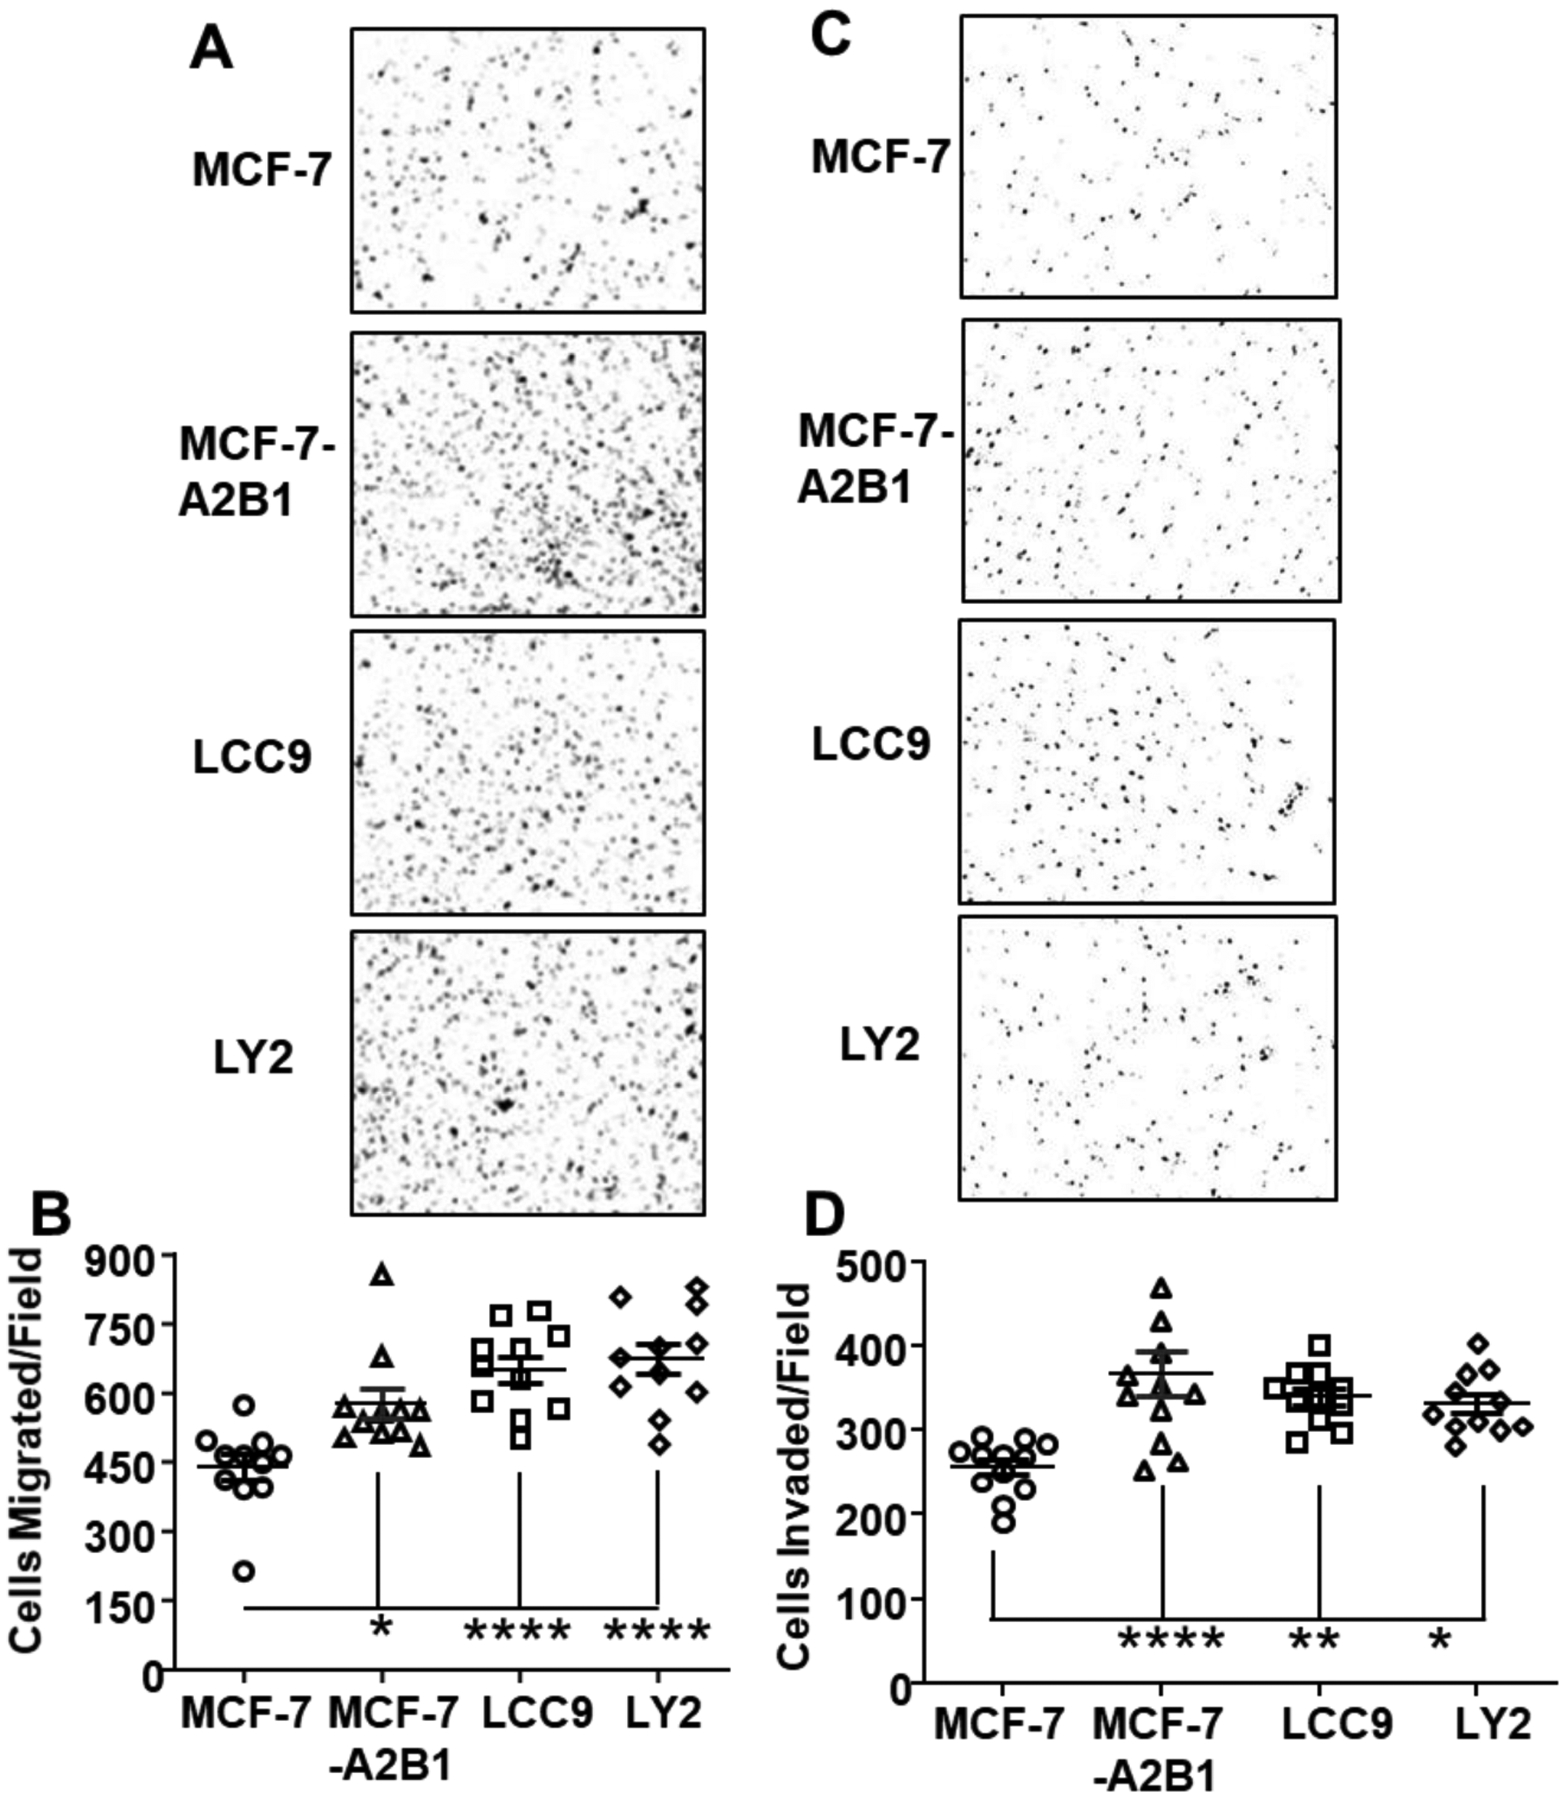
Figure 5: A2B1 enhances MCF-7 cell migration and invasion.

Boyden chamber assays comparing the migration and invasion of MCF-7, MCF-7-A2B1, LCC9, and LY2 cells were performed using FBS-containing medium as the attractant. Cells were grown in SS medium for 72 h prior to plating. Migrated (A) and invaded (C) cells were stained with crystal violet and quantified using ImageJ software. A) Representative images of migrated cells. B) Quantification of cell migration by Image J. C) Representative images of invaded cells. D) Quantification of cell invasion. Values in C and D are from individual wells with 3 wells/treatment. *p < 0.05, **P < 0.001,****p < 0.0001 in one-way ANOVA followed by Tukey’s post hoc multiple com.
