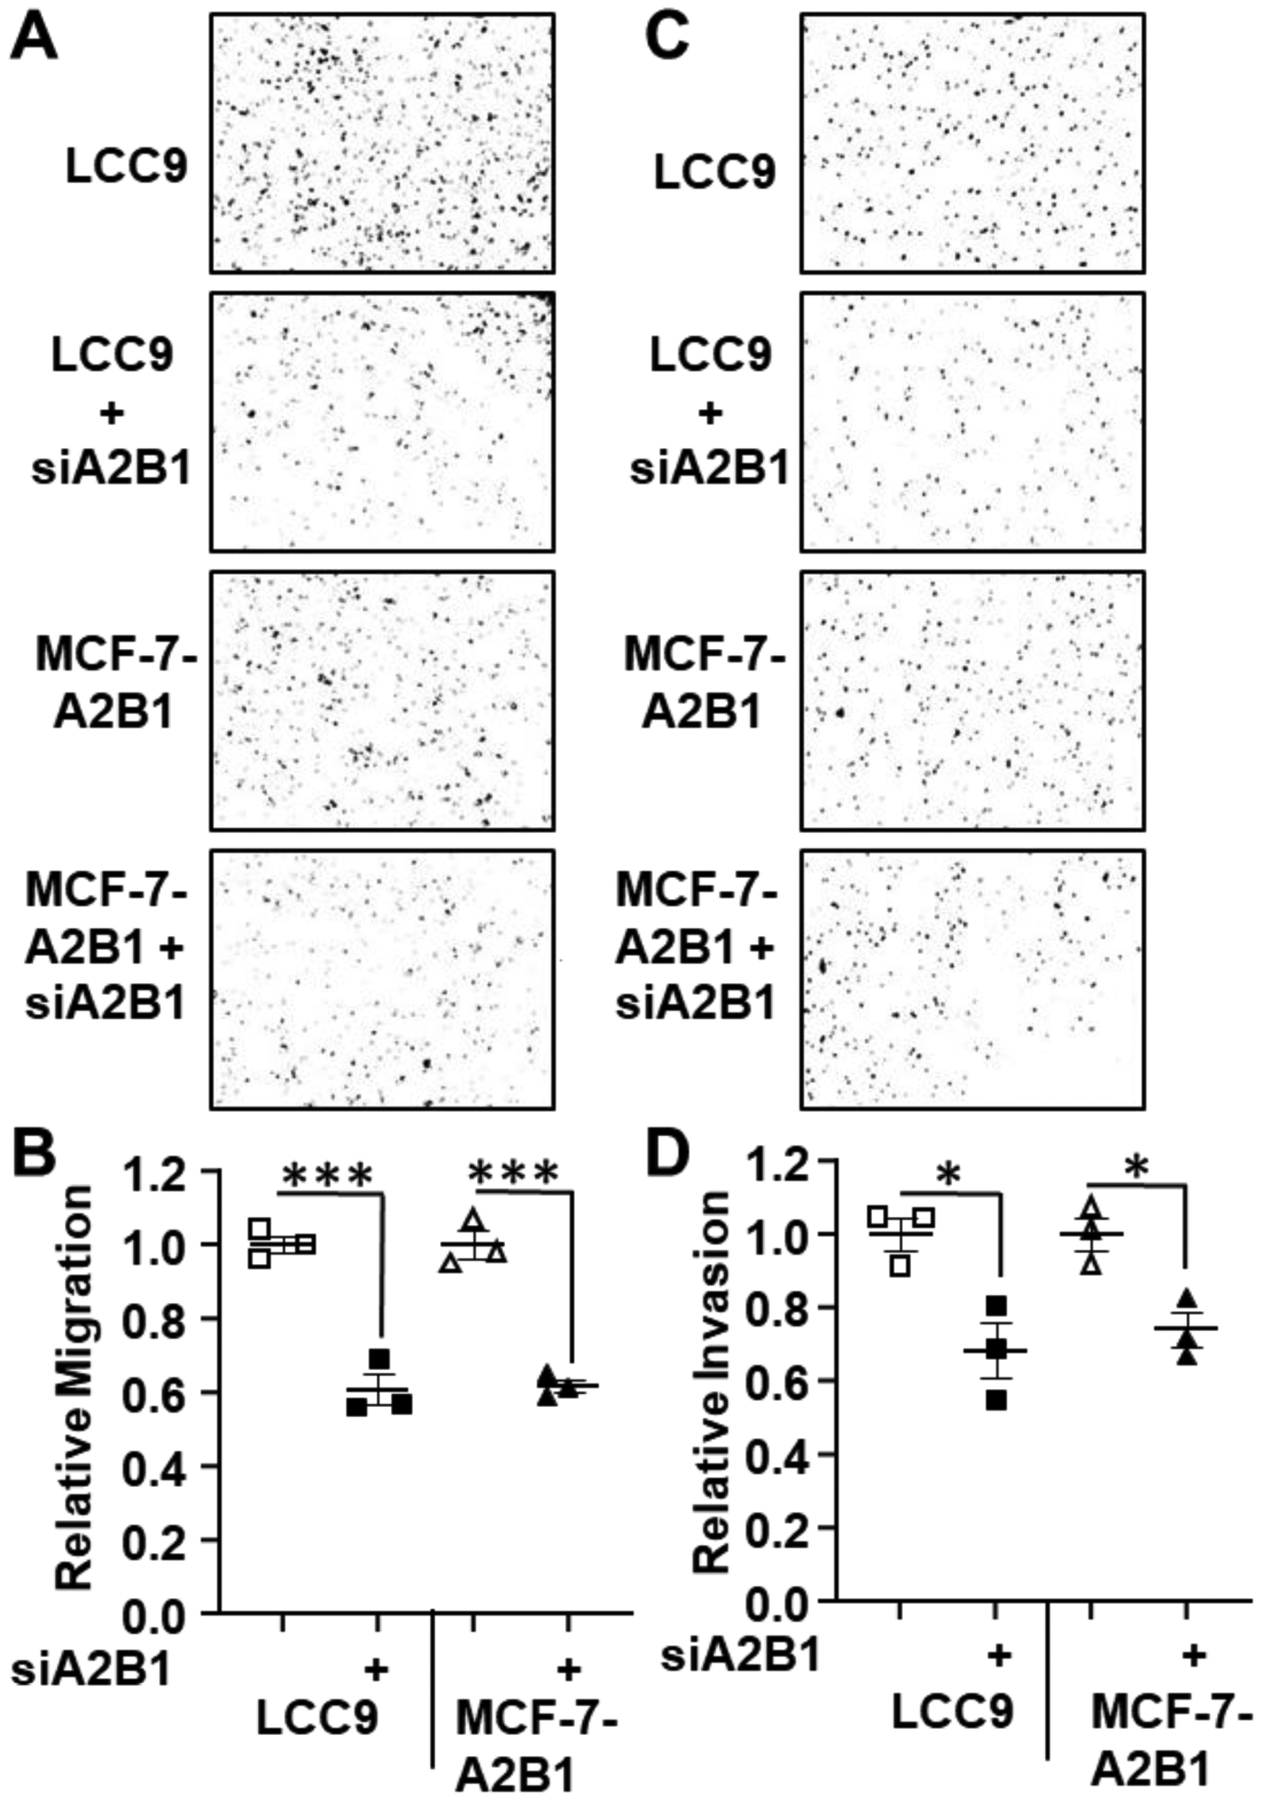
Figure 6: A2B1 knockdown reduces LCC9 and MCF-7-A2B1 cell migration and invasion.

LCC9 and MCF-7-A2B1 cells were transfected with siControl or siHNRNPA2B1 (siA2B1) for 48 h prior to plating for cell migration and invasion assays as in Figure 5. Migrated (A) and invaded (C) cells were stained with crystal violet and quantified using ImageJ software. B and D) Quantification of cell migration and invasion by Image J. Values are relative migration or invasion/well (n = 3 wells/transfection). ***p < 0.001, *p < 0.05 in one-way ANOVA followed by Tukey’s multiple comparison post hoc test.
