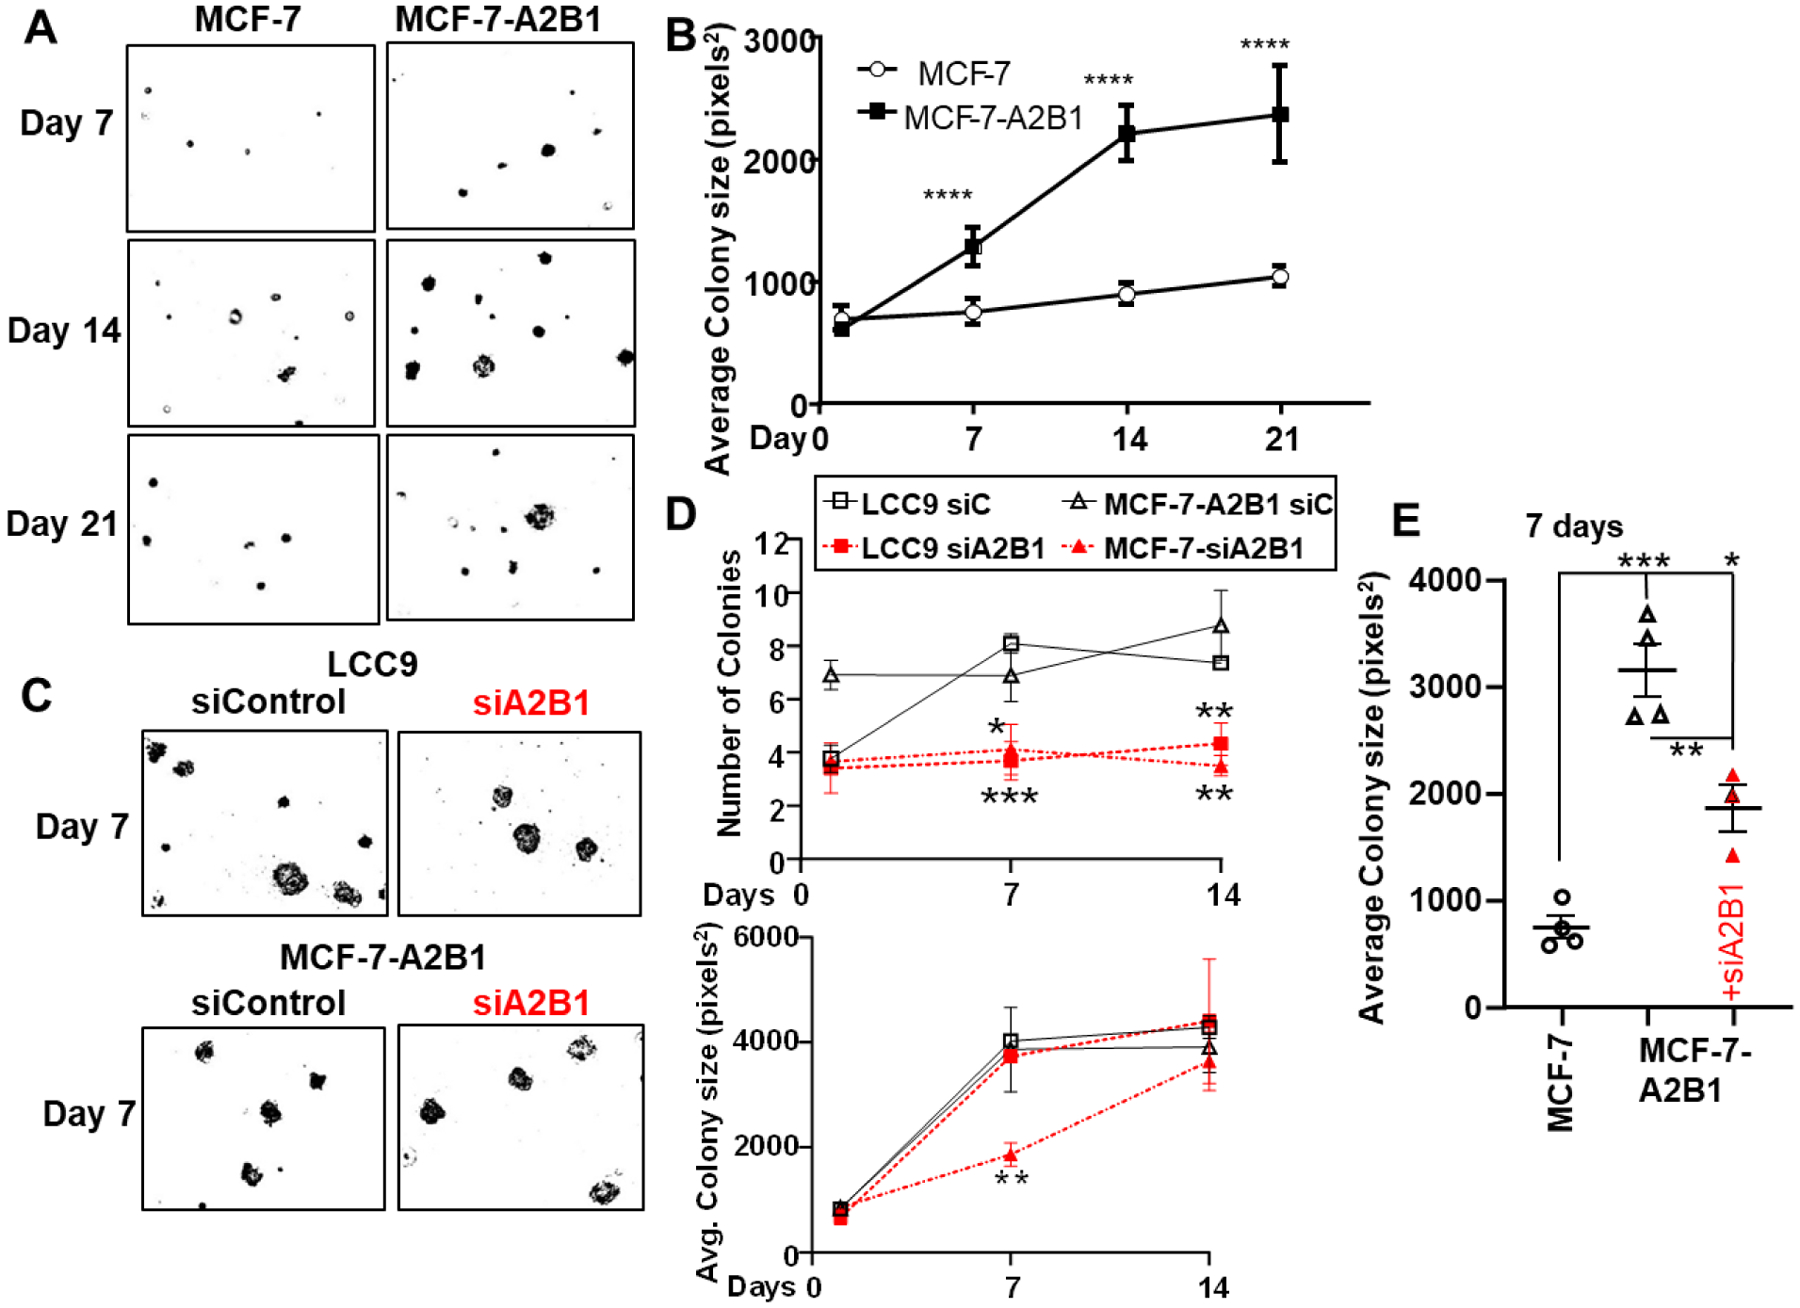
Figure 8: A2B1 increases MCF-7 soft agar colony size and A2B1 knockdown inhibits soft agar colony growth.

A) MCF-7 and MCF-7-A2B1 stable cells were plated 50,000 cells/60mm plate. For data analysis: cell images were captured after 7, 14, and 21 d at 10X on an EVOS microscope. The number of colonies and colony size (area of selection in pixels2) was analyzed by Image J. B) colony size values were averaged from 3 plates/sample and displayed as mean ±SEM. Data were analyzed by two way ANOVA followed by Bonferroni’s post test. *p < 0.0001 C) LCC9 and MCF-7-A2B1 cells were transfected with siControl or siA2B1 for 48 h prior to plating in three separate 60mm plates for soft agar assay/treatment. Data were analyzed by two way ANOVA followed by Bonferroni’s post test. *p < 0.05, **p < 0.01, ***p < 0.001, ****p < 0.0001. E) Colony sizes at 7 d for the MCF-7 and MCF-7-A2B1 +/− siA2B1 transfection were analyzed by one-way ANOVA followed by Tukey’s multiple comparison test. *p < 0.05, **p < 0.01, ***p < 0.0001
