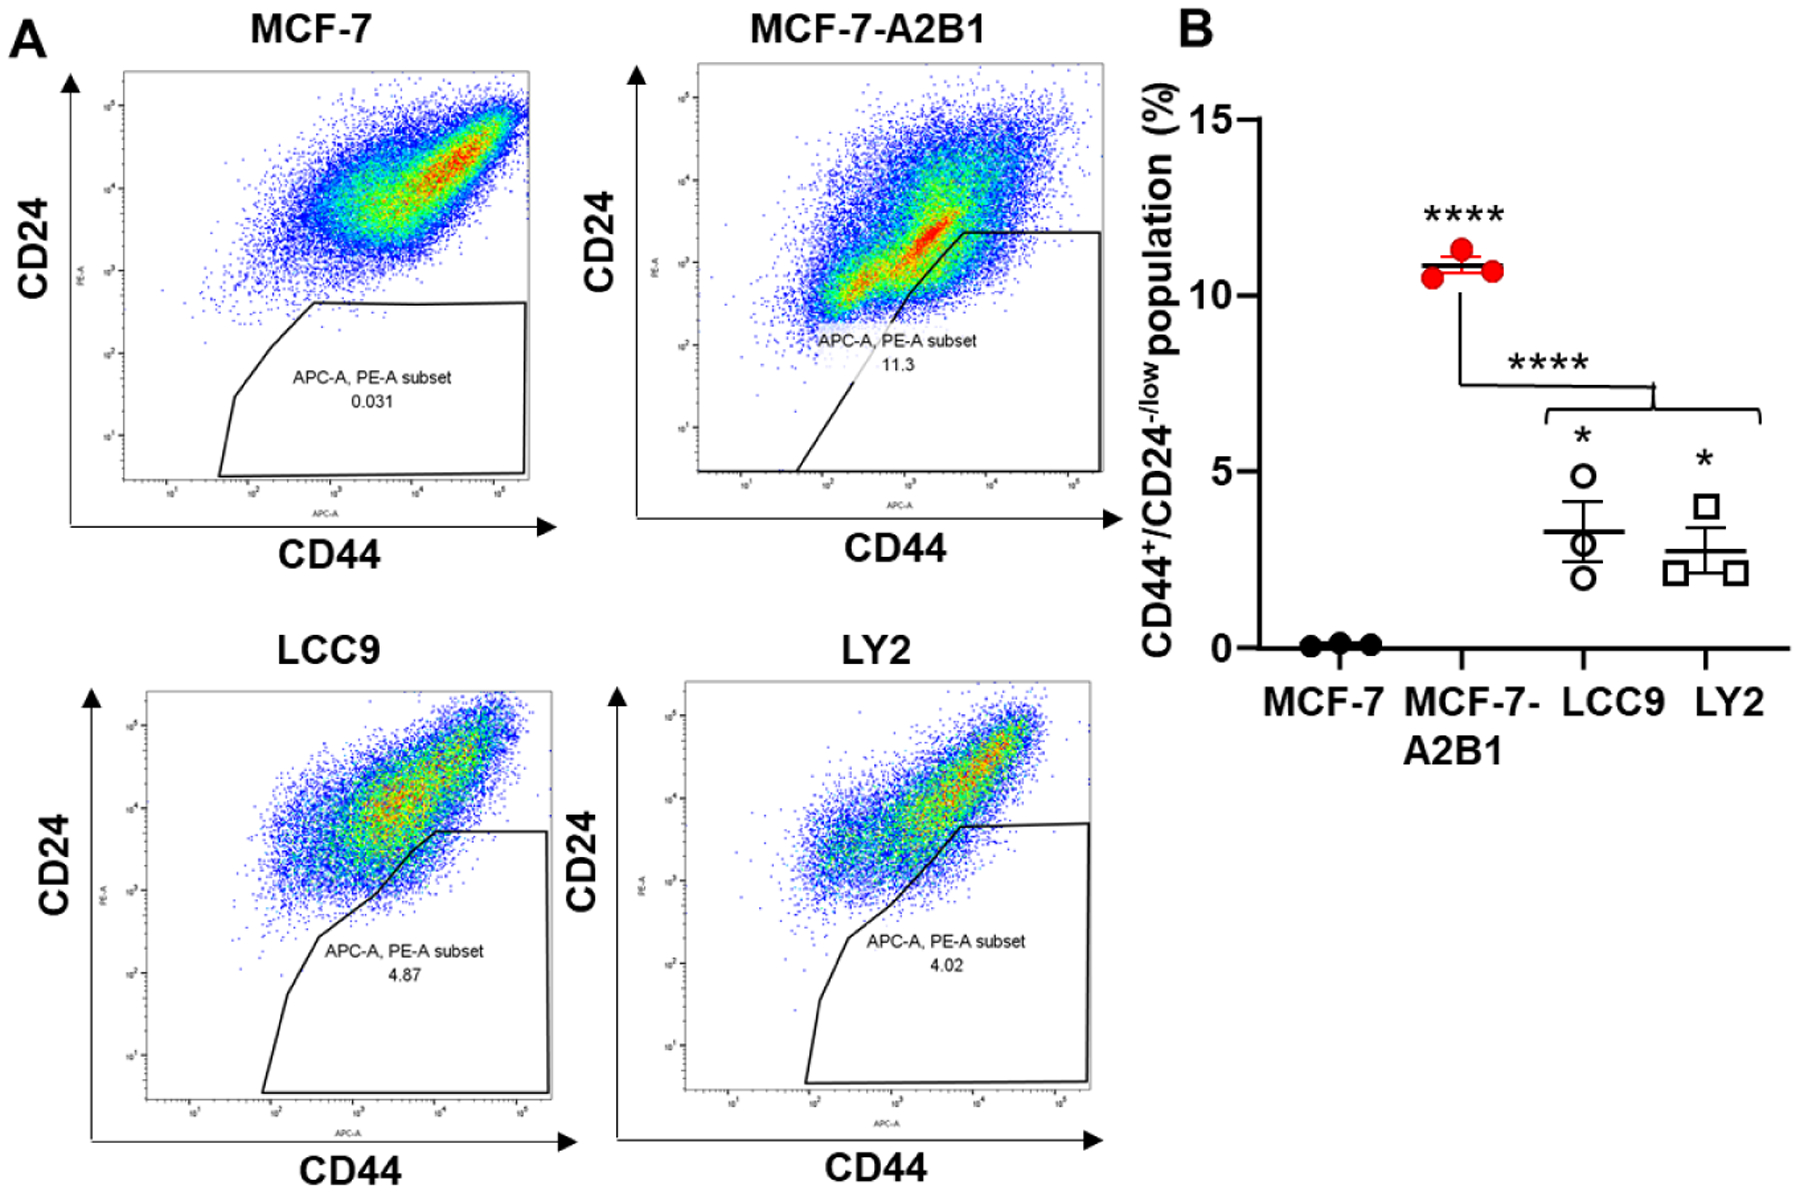
Figure 9: FACS analysis of CD24 and CD44.

A) MCF-7, MCF-7-A2B1, LCC9 and LY2 cells were stained with anti-CD44 APC and anti-CD24 PE. The percent of CD44+/CD24−low cells were analyzed by flow cytometry. Data were quantified from three separate biological replicates of each cell line and plotted % CD44+/CD24−low. Values are mean ± SEM. ****p < 0.001, * p < 0.05 in one-way ANOVA followed by Tukey’s post hoc multiple comparisons test.
