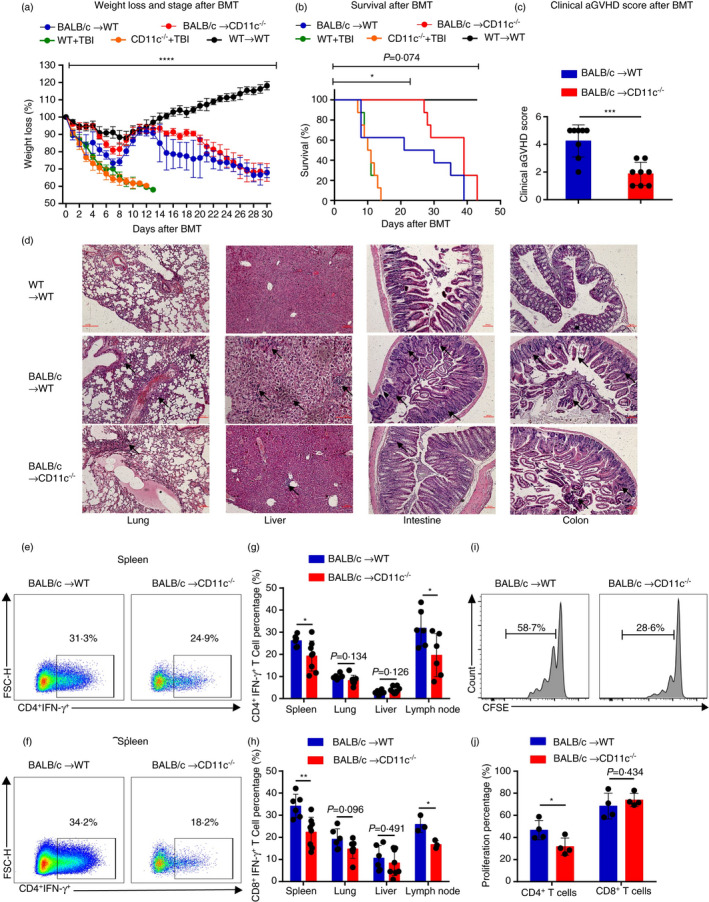
FIGURE 2.

CD11c‐deficient recipient mice had alleviated aGVHD symptoms. (a–h) Lethally irradiated CD11c−/− mice or WT mice were transplanted with 1 × 10⁷ BM cells and 2 × 10⁷ splenic cells from BALB/c mice. (a, b) Lethally irradiated WT mice were transplanted with 1 × 10⁷ BM cells and 2 × 10⁷ splenic cells from WT mice. Lethally irradiated WT mice and CD11c−/− mice without infusion. (a, b) Body weight curves (n = 4–8) (a) and overall survival (n = 4–8) (b) are depicted. (c) Clinical aGVHD scores of recipients CD11c−/− mice and WT mice 14 days after BMT. (d) Representative haematoxylin‐ and eosin‐stained sections of the lung, liver, intestine and colon from recipient CD11c−/− mice and WT mice and autotransplantation WT mice (scale bar, 100 μm). The arrows were used to indicate the representative areas. Lung GVHD showed bronchiolitis with lymphohistiocytic infiltration. The marked epithelial damage was also observed. Hepatic GVHD showed an extensive lobular hepatitis with intense lymphocytic inflammation of sinusoids and portal spaces, and hepatocellular necrosis. Gut GVHD showed numerous lymphocytes infiltrated the glands within the oedematous mucosa. Apoptosis was widespread, along with segmental disruption of the glands. The degenerative colonic crypts were observed in colon. (e, f) Representative flow cytometric analysis of CD4+ IFN‐γ+ T‐cell (e) and CD8+IFN‐γ+ T‐cell (f) percentages in recipient mice in spleen 14 days after BMT. (g, h) Percentages of CD4+ IFN‐γ+ T cells (n = 6–8) (g) and CD8+ IFN‐γ+ T cells (n = 3–8) (h) in recipient mice in spleen, lung, liver and lymph node 14 days after BMT. (i, j) Lethally irradiated CD11c−/− mice and WT mice were transplanted with 1 × 10⁷ T‐cell‐deleted (TCD) BM cells and 5 × 10⁶ CFSE‐labelled CD3+ T cells sorted from spleens of BALB/c mice (n = 4). (i) Representative flow cytometric analysis of CFSE‐labelled CD4+ T cell in recipient mice in spleen 3 days after BMT. (j) Percentages of proliferative donor CD4+ T cell and CD8+ T cells in spleen 3 days after BMT. Results are presented as mean ± SD, *P < 0·05, **P < 0·01, ***P < 0·001, ****P < 0·0001, Student's t‐test (c, g, h, j), two‐way ANOVA (a) and log‐rank (Kaplan–Meier method) test (b). All data are representative of three independent experiments
