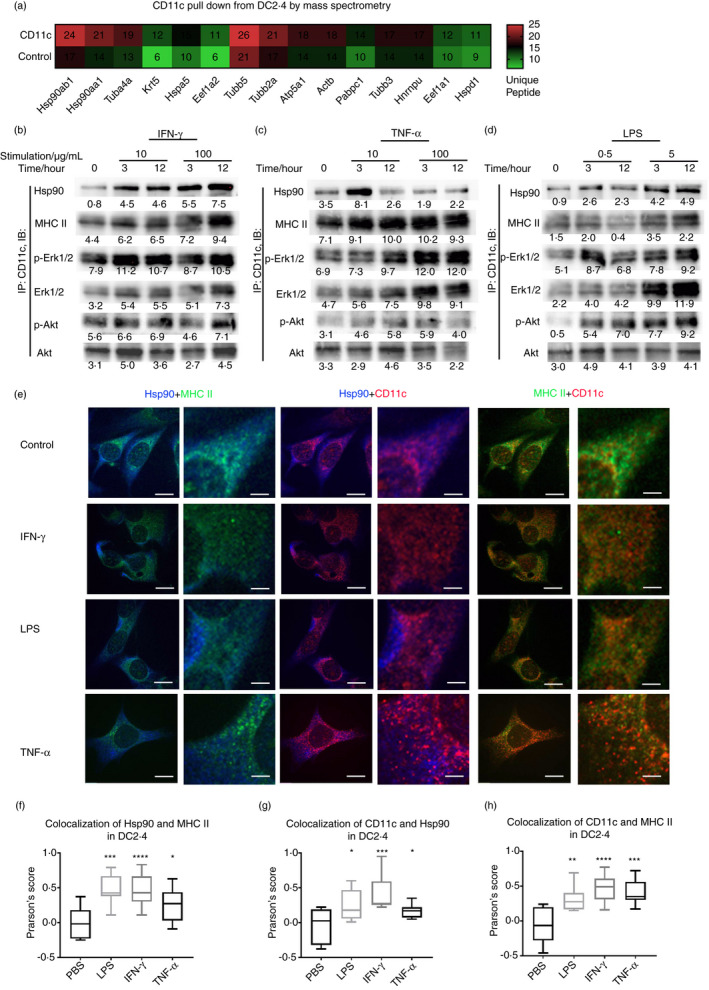
FIGURE 5.

The downstream molecules interacted with CD11c after multiple inflammatory stimulations. (a) Proteins pulled down by CD11c from DC2.4 cells were analysed by mass spectrometry and ranked by the amount of unique peptides. (b–d) After incubation with 10 ng/ml IFN‐γ, 100 ng/ml IFN‐γ (b), 10 ng/mL TNF‐α, 100 ng/mL TNF‐α (c), 0.5 µg/ml LPS and 5ug/ml LPS (d) for 0, 3 or 12 h, DC2.4 cells were collected, coimmunoprecipitation was performed by CD11c antibody, and Hsp90, MHCII, phosphorylated Akt, total Akt, phosphorylated Erk1/2 and total Erk1/2 levels were detected by Western blotting. (e) Representative Hsp90, MHCII and CD11c confocal microscopy in DC2.4 cells treated with IFN‐γ, LPS and TNF‐α. Hsp90 was labelled in blue, MHCII in green and CD11c in red, bar = 50 μm. (f–h) Colocalization of Hsp90/MHCII (f), CD11c/Hsp90 (g) and CD11c/MHCII (h) of DC2.4 cells treated with IFN‐γ, LPS and TNF‐α, calculated regions of interest by Pearson's Score System (NIH) using ImageJ–Coloc2 with Pearson's Score Algorithm (https://imagej.net/Colocalization_Analysis)
