FIGURE 4.

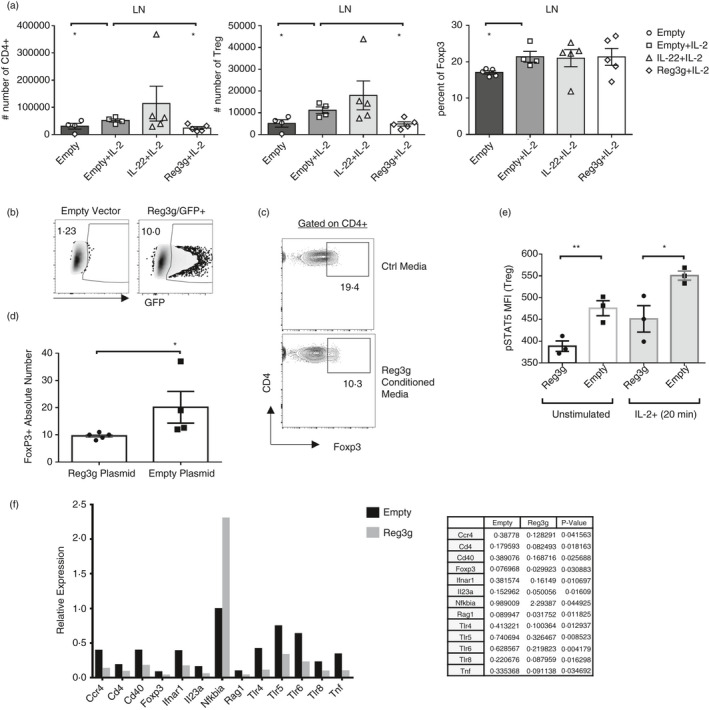
Reg3γ blocks Treg expansion in vivo and ex vivo (a) Foxp3‐YFP or B6 mice were injected with 2 ml of saline containing 15 µg/ml plasmid (IL‐22, Reg3γ or empty plasmid as control) on day −2 or −1. Then, on starting day 0, the mouse groups received 100 µl of intraperitoneal injections of 5 ng IL‐2 per gram mouse (in PBS), daily for 7 days. The mice were killed on day 7, and the absolute number of CD4+ T cells and Treg cells and Treg cell percentage in LNs (inguinal and brachial) (a) were quantified. (b) HEK293 T cells were transfected with Reg3γ or empty plasmid or as control GFP vector. The supernatant (conditioned media) was collected on days 2 and 5. (c) Filtered antibiotic‐added conditioned media were added into CD3/CD28‐activated sorted splenocytes obtained from Foxp3‐YFP reporter mice and cultured for 3 days. A representative flow plot of Treg cell expansion. (d) Quantification of the absolute number of Treg cells in ‘C’. (e) Sorted CD4+ Foxp3‐YFP+ Treg cells were cultured for 2 h in Reg3γ or empty plasmid‐conditioned media from HEK293 T cell transfections. Then, cells were stimulated with IL‐2 and STAT5 phosphorylation was quantified by nuclear staining. MFI indicates mean fluorescent intensity. (f) Splenocytes from B6 mice were cultured for 24 h in Reg3γ or empty plasmid‐conditioned media from HEK293 T cell transfections with the addition of CD3/CD28 1 µg/ml each. Both the adherent and suspension cells were collected and used for real‐time qPCR array (Qiagen, PAMM 52Z‐Mouse). A bar graph (top) and list (bottom) of differentially regulated genes (p < 0·05 for all) are given. (*) indicates p‐value <0·05; and (**), p < 0·01. Experiments in (a–e) were repeated three times
