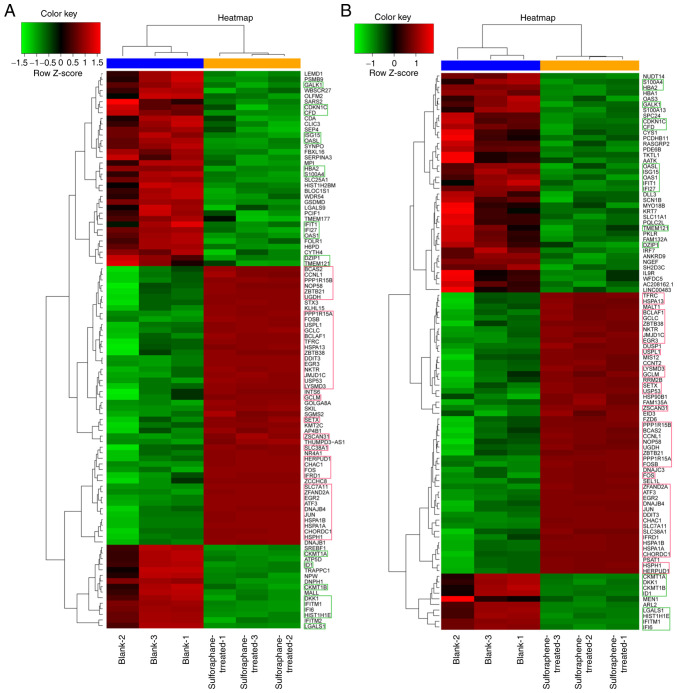
Figure 3.
Hierarchical clustering analysis of differentially expressed genes following SW480 cell treatment with sulforaphane and sulforaphene. (A) Sulforaphane-treated vs. blank. (B) Sulforaphene-treated vs. blank. Red represents an increase in gene expression following treatment, whereas green denotes a decrease. The genes that changed consistently after treatment with both compounds are highlighted in red and green boxes.

