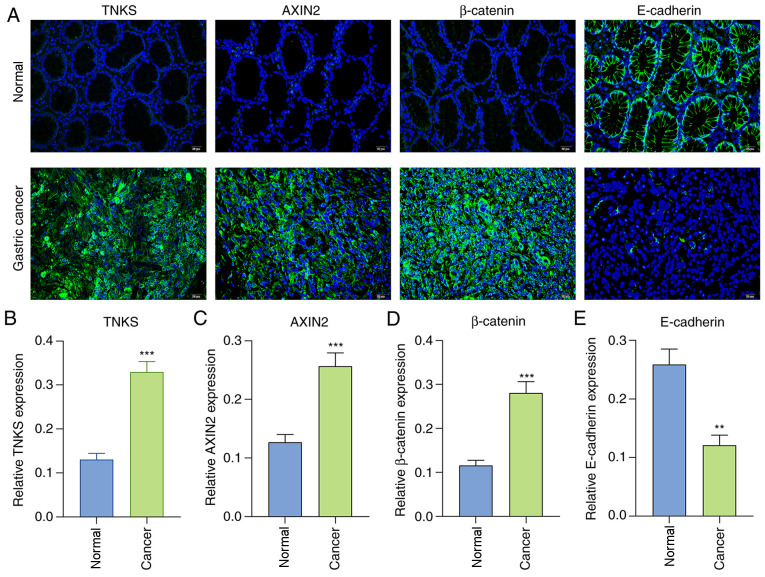
Figure 2.
Immunofluorescence analysis of TNKS, AXIN2, β-catenin and E-cadherin between gastric cancer tissues and adjacent normal tissues. (A) Representative images of immunofluorescence analysis. Scale bar, 20 µm. (B) TNKS, (C) AXIN2 and (D) β-catenin expression levels were upregulated in gastric cancer tissues compared with normal tissues. (E) E-cadherin expression was downregulated in gastric cancer tissues compared with normal tissues. **P<0.01 and ***P<0.001 vs. normal tissues. TNKS, Tankyrases.

