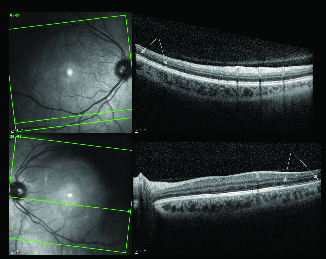
Figure 4.

The upper and lower pictures are macular optical coherence tomography of the right and left eye, respectively. Arrows show the areas of disruption and segmentation of the ellipsoid zone in the right eye and thinning of (absent in some areas) ellipsoid zone in the left eye.
