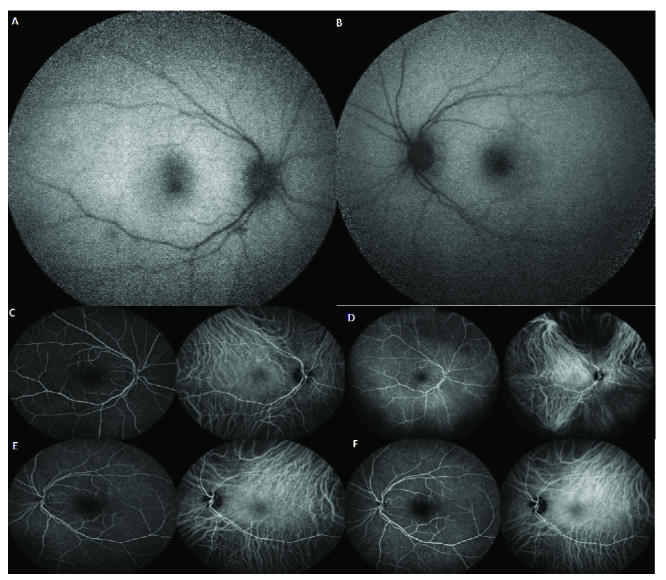
Figure 5.

A and B illustrate fundus autofluorescence (FAF) of the right and left eyes, respectively. These images appear normal. C and D are early and late images of fluorescein angiography and indocyanine green angiography of the right eye, respectively. They are within the normal limit. E and F are early and late images of fluorescein angiography and indocyanine green angiography of the left eye, respectively. They are within the normal limit.
