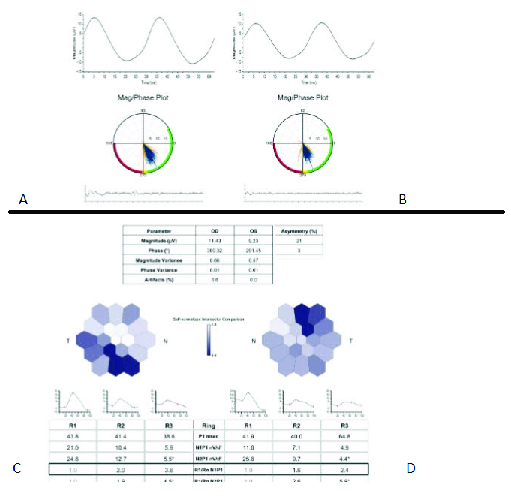
Figure 7.

A and B illustrate fixed-luminance electroretinography (ERG) on Diopsys, which is equal to 30-Hz flicker conventional ERG. Waves have normal magnitude (amplitude) and phase (implicit time) in both eyes. Graphs show rays (blue lines) in the green area that means within the normal limit. C and D show multifocal ERG of the right and left eyes, respectively. C shows abnormal area inferotemporal correspondents with ellipsoid zone segmentation and disruption on macular optical coherence tomography. D shows abnormal areas in temporal and supratemporal correspondent with ellipsoid zone thinning (absent in some areas) on the macular optical coherence tomography.
