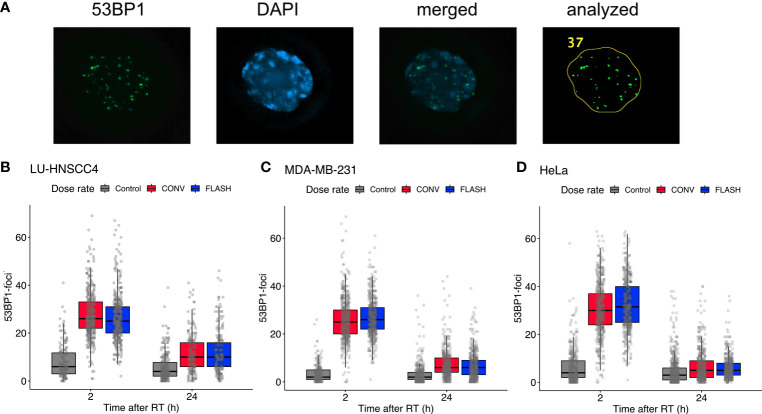
Figure 2.
Evaluation of radiation-induced DNA-double strand break foci using 53BP1. (A) Representative microscopy image showing (left to right) 53BP1, DAPI, merged image, and the resulting analyzed image after processing in ImageJ. (B–D) Number of 53BP1 foci at 2 h and 24 h after 3 Gy irradiation with FLASH (blue) or conventional dose rate (CONV, red) compared with controls (grey) for LU-HNSCC4 (B; 1,532 scored cells), MDA-MB-231 (C; 2,583 scored cells), and HeLasubclone (D; 2,973 scored cells). The box and whisker plots illustrate median (thick line), interquartile range (box) and the lowest/highest observation within ±1.5* interquartile range (IQR) from the box (whiskers). The individually scored cells are indicated with transparent circles. Data from two independent experiments.

