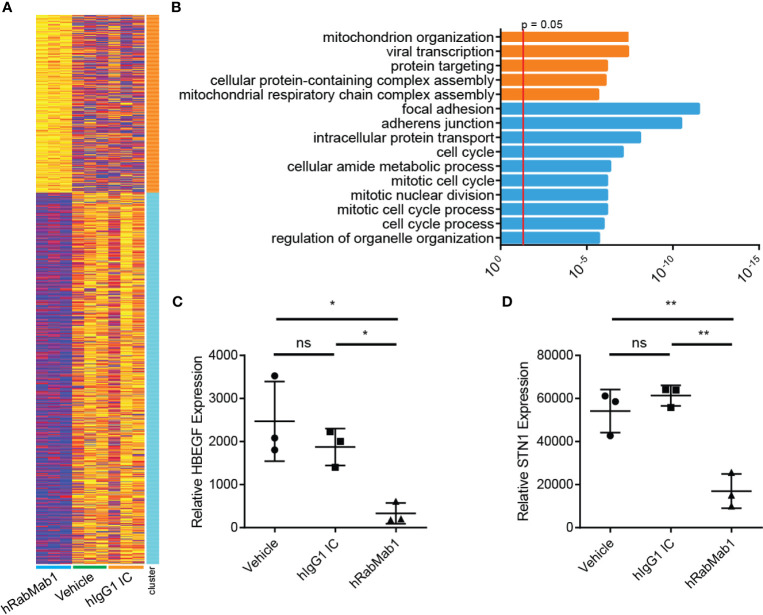
Figure 5.
RNAseq analysis of tumor tissue harvested from pharmacodynamic studies. RNA was isolated from 3 tumors from each group representing the median tumors of that group. (A) Following library preparation clustering was performed using ToppGene from which a heat map was produced highlighting differences of mRNA expression levels between hRabMab1 treated tumors and those treated with either vehicle or IgG isotype control. (B) ToppGene functional enrichment analysis of RNAseq data differentially-expressed genes highlighting strong downregulation of gene transcripts associated with cell cycle and focal adhesion biological processes and cellular component when tumors are treated with hRabMab1. mRNA expression levels of (C) HBEGF and (D) STN1 in these tumors were quantified by qRT-PCR. *p ≤ 0.05; **p ≤ 0.01; ns, not significant.

