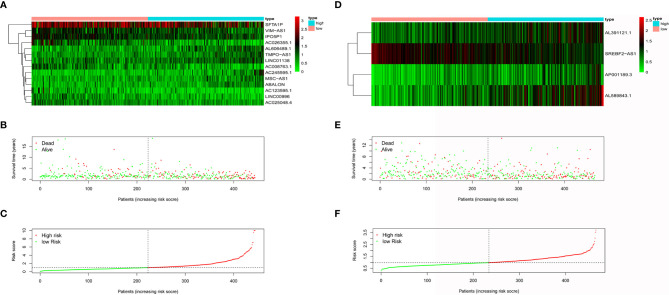
Figure 2.
The effectiveness evaluation of risk score. Heatmap of model lncRNAs expression level for AD patients (A) and SCC patients (D) in low-risk group and high group. Survival condition of AD patients (B) and SCC patients (E) in low-risk group and high group. Risk score curve of AD patients (C) and SCC patients (F) in low-risk group and high group.

