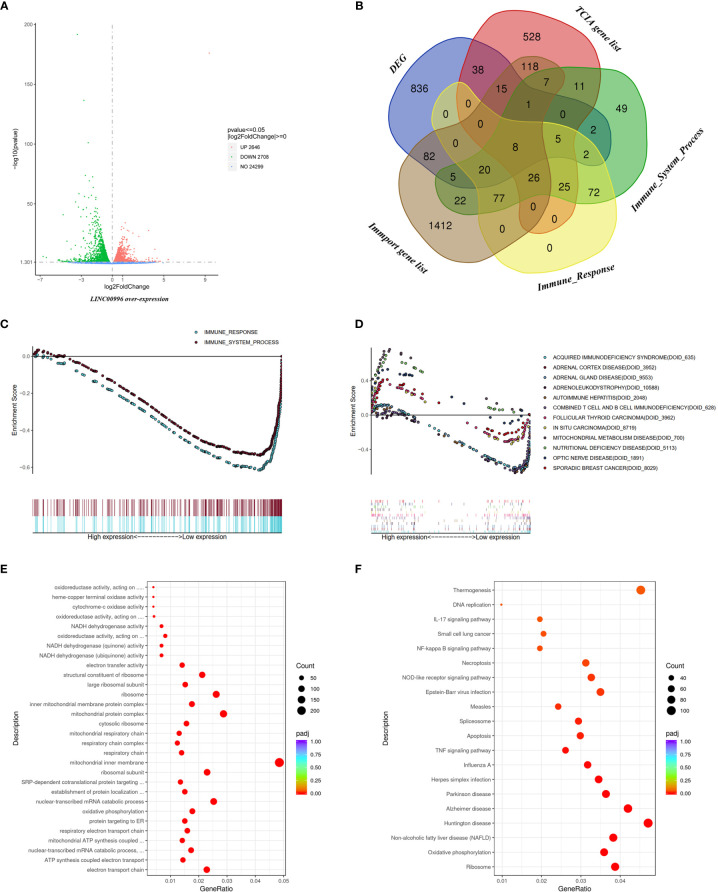
Figure 7.
Functional analysis based on RNA-seq data. (A) The DEGs between A549 with over-expressed LINC00996 and control group exhibited via Volcano diagram. (B) The intersection between DEGs, TCIA gene list, Immune_System_Process from GSEA, Immune_Response from GSEA and Immport gene list exhibited via Venn diagram. Enrichment analyses including immune-related gene sets (C) and Disease Ontology (D) via GSEA analysis, Gene Ontology (E) and Kyoto Encyclopedia of Genes and Genomes term (F) based on the DEGs between A549 with over-expressed LINC00996 and control group.

