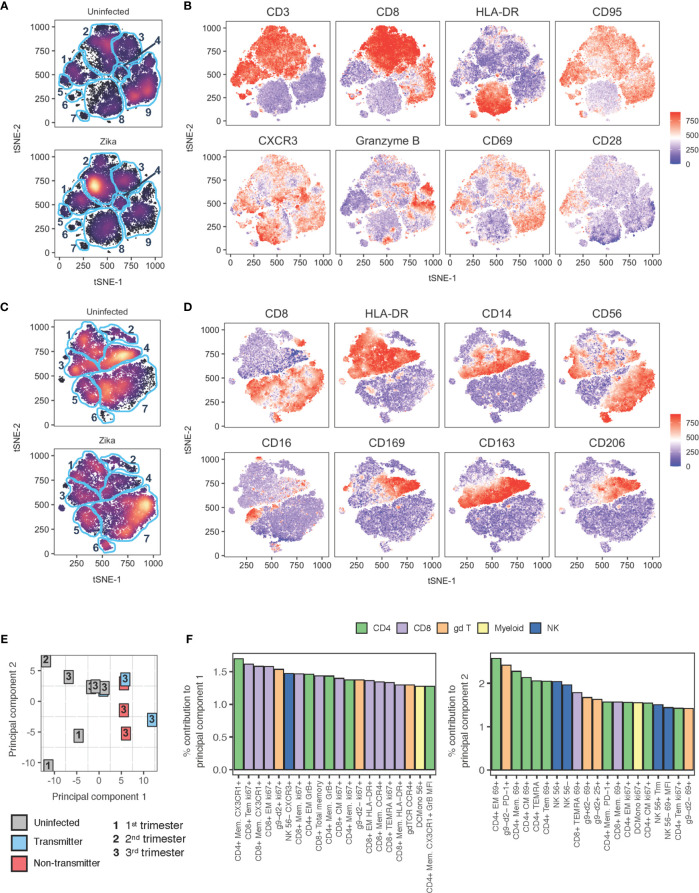
Figure 13.
tSNE and PCA analysis of decidual leukocytes of uninfected and ZIKV-infected rhesus macaques. (A) tSNE plot representing an equal number of CD45+/live/single cells/leukocytes cells from decidua of rhesus macaques experiencing a normal pregnancy (n = 9) or after ZIKV infection (n = 8). The 28-color adaptive panel was used to generate this plot. Blue gates were manually drawn based on clustering patterns. (B) Individual MFI gradients of eight markers on the tSNE map. Red coloring represents high MFI and blue coloring represents low MFI. (C) tSNE plot representing an equal number of CD45+/live/single cells/CD3-/CD20- cells from decidua of rhesus macaques experiencing a normal pregnancy (n = 8) or after ZIKV infection (n = 7). The 18-color innate panel was used to generate this plot. Blue gates were manually drawn based on clustering patterns. (D) Individual MFI gradients of eight markers on the tSNE map. Red coloring represents high MFI and blue coloring represents low MFI. (E) PCA plot of decidual leukocytes of uninfected and ZIKV-infected dams. (F) The top 20 contributing variables to principal component 1 (left) and principal component 2 (right) are shown and color coded according to major cell populations, CD4+ T (green), CD8+ T (purple), γδ T (orange), myeloid CD20-HLA-DR+ (yellow), and NK cells (blue).

