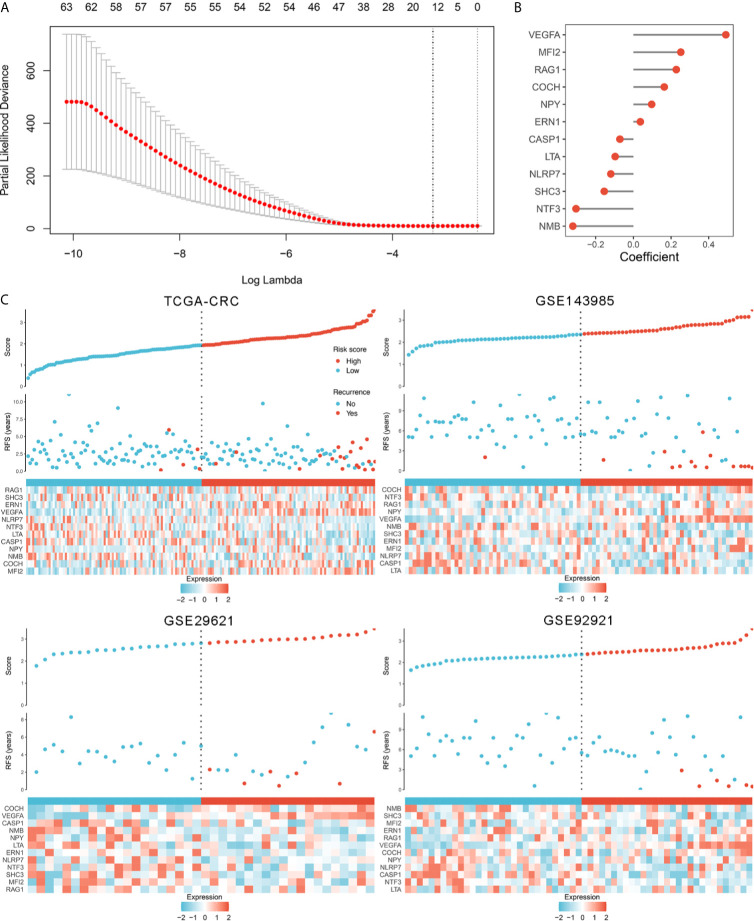
Figure 2.
The development of the RAIS model based on the LASSO algorithm. (A) Ten-fold cross-validations to tune the parameter selection in the LASSO model. The two dotted vertical lines are drawn at the optimal values by minimum criteria (left) and 1−SE (standard error) criteria (right). (B) LASSO coefficient profiles of the candidate genes for RAIS construction. (C) The distribution of risk score, recurrence status, and gene expression panel in four cohort.

