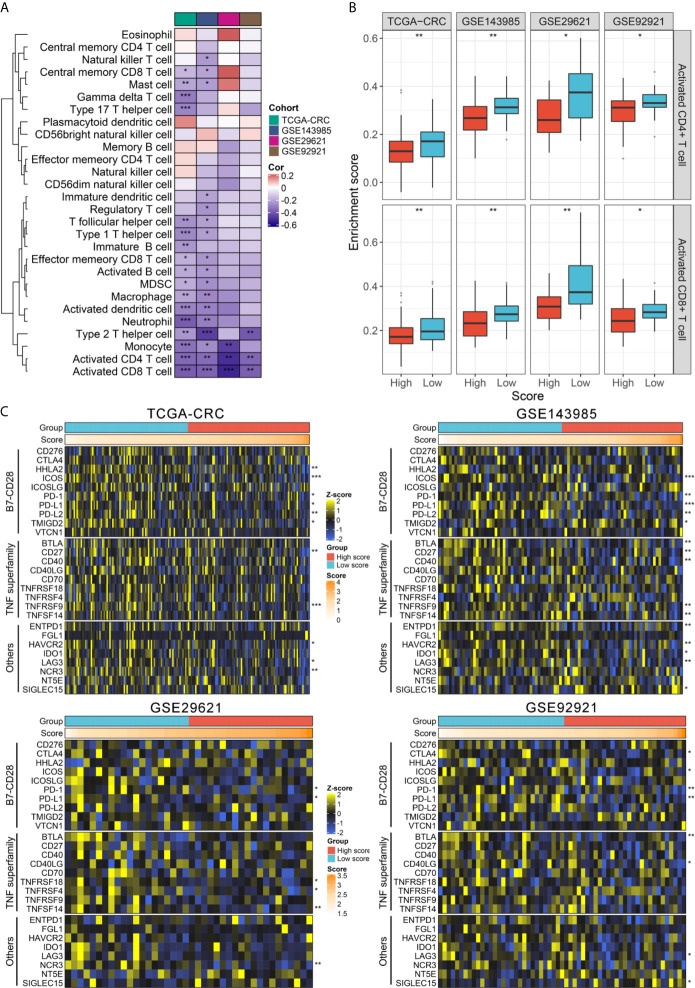
Figure 5.
TIME landscape and immune checkpoints profiles of RAIS in four cohorts. (A) The correlation analysis between RAIS and 28 immune cells infiltration abundance. (B) The distribution difference of activated CD4+/CD8+ T cells infiltration between the high-risk and low-risk groups. (C) Four heatmaps of 27 immune checkpoints profiles in high-risk and low-risk groups. *P < 0.05, **P < 0.01, ***P < 0.001.

