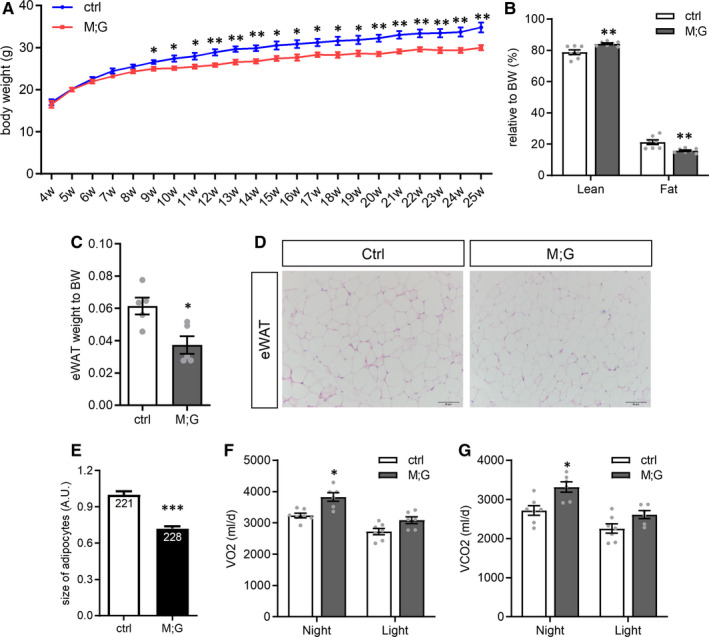
FIGURE 3.

Reduced bodyweight gain of the M;G mice. (A) Growth curves of control and M;G mice from 4 to 25 wks of age. n = 7 control mice, n = 8 M;G mice. (B) Body composition of control and M;G mice measured at the age of 22 weeks. n = 7. (C) Relative eWAT weight of control and M;G mice at the age of 7‐8 mo. n = 5. (D) Histology of the adipose from control and M;G mice. Scale bar: 50 μm. (E) Cell size of the adipose from control and M;G mice. The numbers shown in the bar graphs indicated the number of cells measured in the experiments. (F) Oxygen consumption of the mice. n = 7 control mice, n = 6 M;G mice. (G) Carbon dioxide production of the mice. n = 7 control mice, n = 6 M;G mice. Data were analysed via ANCOVA in F‐G. Values are means ± SEMs, *P < .05; **P < .01; ***P < .001 (unless stated, data were analysed via t test).
