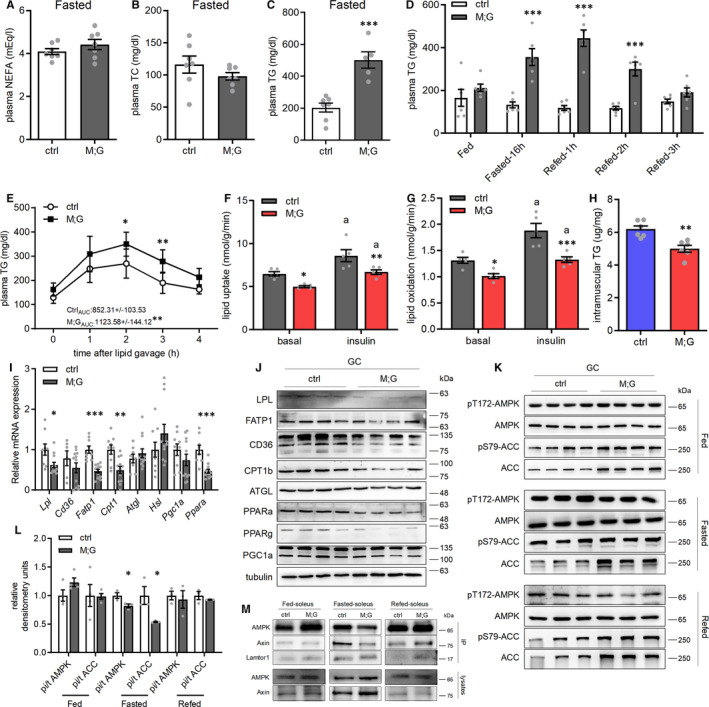
FIGURE 4.

Reduced capacity of lipid uptake and oxidation in the muscle of the M;G mice. (A‐C) Plasma NEFA (A), TC (B) and TG (C) levels in the overnight‐fasted mice at 3‐4 mo of age. n = 7. (D) Plasma TG levels in the fed, 16h‐fasted and fasting‐refed control and M;G mice. n = 6. (E) Plasma TG levels after lipid oral gavage in control and M;G mice at the age of 7 mo. Data were analysed via two‐way ANOVA with Bonferroni's post hoc test. The values showed the TG area under the curve during lipid tolerance test. n = 7 control mice, n = 6 M;G mice. (F) Lipid uptake in isolated soleus muscle of the 4‐month‐old female mice. n = 5. Data were analysed via two‐way ANOVA with Bonferroni's post hoc test. (G) Lipid oxidation in isolated soleus muscle of the 4‐month‐old female mice. n = 5. Data were analysed via two‐way ANOVA with Bonferroni's post hoc test. (H) TG levels in TA muscle from the fasted mice at the age of 4 months. n = 6. (I) mRNA expression of lipid metabolic genes in GC muscle from the overnight‐fasted mice. n = 9 control mice, n = 12 M;G mice. (J) Protein expression of lipid metabolic genes in GC muscle from the overnight‐fasted mice. (K) Expression and phosphorylation of AMPK and ACC in GC muscle from the fed, fasted and fasting‐refed mice. (L) Quantification of the pi‐AMPK/AMPK, pi‐ACC/ACC ratios in (K). (M) Representative Western blots showing the amount of AMPK and Axin for soleus muscle from the mice under different feeding states. Lamtor1 was immunoprecipitated from tissue extracts and then immunoblotted with AMPK, Axin and Lamtor1 antibody to determine the amount of each protein. Unless stated, male mice were applied for the experiments. Values are means ± SEMs, *P < .05; **P < .01; ***P < .001 (unless stated, data were analysed via t test). For (F) and (G), a indicates P < .05 (insulin vs basal of the same genotype)
