
FIGURE 5.
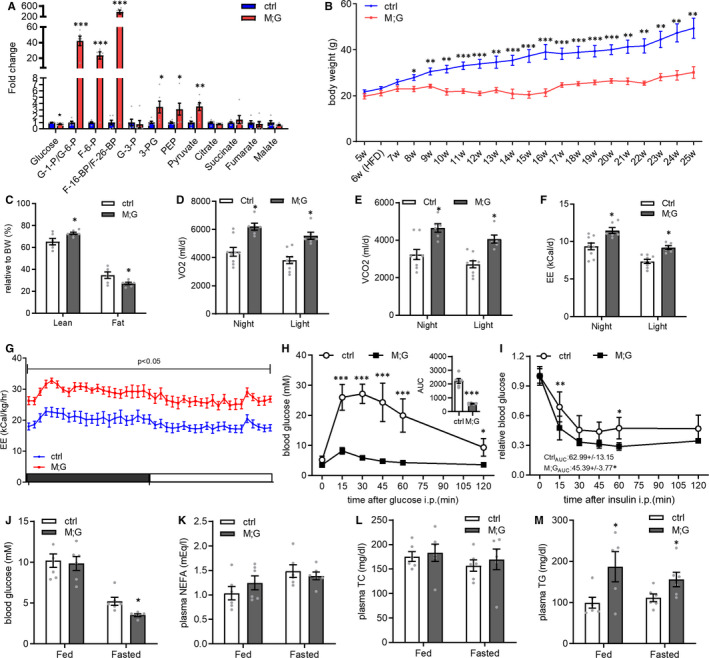
Alleviation of HFD‐induced obesity and insulin resistance in the M;G mice. (A) Fold changes of glucose metabolic intermediates in GC muscle of the mice fed on HFD. n = 6. (B) Growth curves of the HFD‐fed control and M;G mice from 5 to 25 wks of age. n = 6. (C) Body composition of the HFD‐fed mice at the age of 7‐8 mo. n = 6. (D) Oxygen consumption of the mice fed on HFD. n = 9 control mice, n = 6 M;G mice. (E) Carbon dioxide production of the mice fed on HFD. n = 9 control mice, n = 6 M;G mice. (F) EE in control and M;G mice fed on HFD. n = 9 control mice, n = 6 M;G mice. Data were analysed via ANCOVA in D‐F. (G) Adjust energy expenditure per hour during the light/dark cycle of the mice fed on HFD. The measurements were normalized to mouse bodyweight. n = 9 control mice, n = 6 M;G mice. (H) IPGTT in the HFD‐fed control and M;G mice at the age of 4.5 mo. Insert: the glucose area under the curve during IPGTT. n = 6 control mice, n = 5 M;G mice. (I) ITT in the HFD‐fed control and M;G mice at the age of 4‐4.5 mo. The values showed the glucose area under the curve during ITT. n = 6. Data were analysed via two‐way ANOVA with Bonferroni's post hoc test in H‐I. (J‐M) Blood glucose (J), plasma NEFA (K), TC (L) and TG (M) levels in the HFD‐fed mice at the age of 4‐4.5 mo. n = 6. Values are means ± SEMs, *P < .05; **P < .01; ***P < .001 (unless stated, data were analysed via t test). G‐6‐P/G‐1‐P: glucose‐monophosphate, F‐6‐P: fructose‐6‐phosphate, F‐1,6‐BP/F‐2,6‐BP: fructose‐bisphosphate, 3‐PG: 3‐phosphoglycerate, PEP: phosphoenolpyruvic acid.