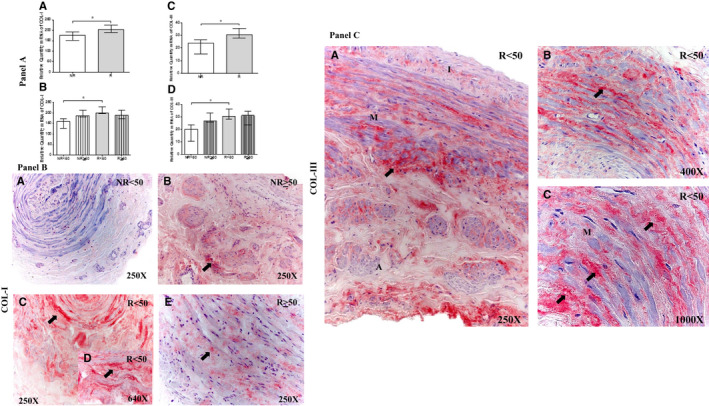
FIGURE 3.

Panel A, Expression levels of Collagen Type I (COL‐I) mRNA (A and B) and Collagen Type III (COL‐III) mRNA (C‐D) in the different study groups. Panel B. Images of the protein expression (COL‐I) in the venous wall of the different study groups (A‐E). Panel C. Images of the protein expression (COL‐III) in the venous wall of the different study groups (A‐C). NR<50, patients younger than 50 y without reflux; NR≥50, patients without reflux aged 50 y or older; R < 50, patients younger than 50 y with reflux; R ≥ 50, patients with reflux aged 50 y or older; I, tunica intima; M, tunica media; A, tunica adventitia. The arrow indicates COL‐I and COL‐III protein expression in the vein wall. P < .05. asterisk = green colouration. NR (n = 29) [NR<50 (n = 13); NR≥50 (n = 16)]; R (n = 81) [R < 50(n = 32); R ≥ 50 (n = 49)]. For statistical analyses, was used Mann‐Whitney U test
