
FIGURE 1.
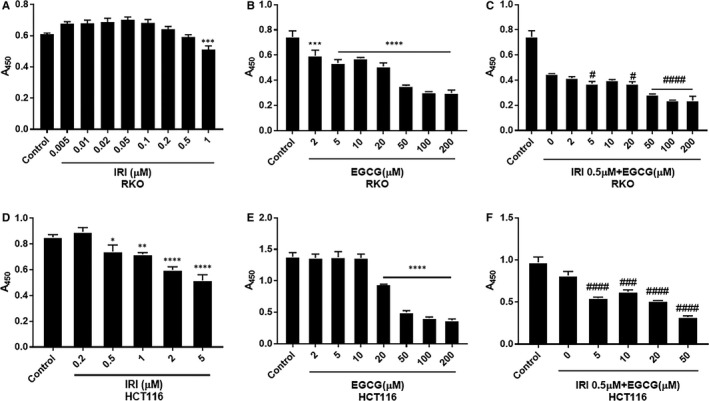
CCK8 assay to detect the proliferation of RKO and HCT116 cells treated with irinotecan and/or EGCG at different concentrations after 24 h. A‐C, are irinotecan, EGCG, 0.5μM irinotecan + EGCG in RKO cells, and D‐F, in HCT116 cells. *P < .05, **P < .01, ***P < .005, ****P < .001 (compared with the control group); # P < .05, ## P < .01, ### P < .005, #### P < .001 (compared with IRI 0 µmol L− group)