
FIGURE 4.
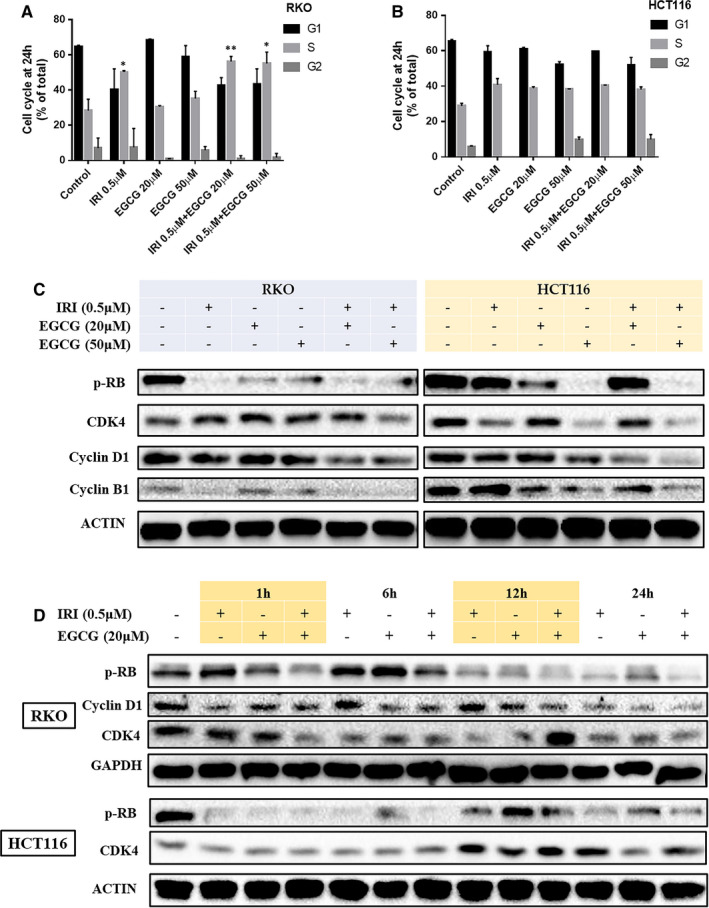
Effects of EGCG on the cell cycle of irinoticam pre‐treated RKO and HCT116. Representative graph of cell cycle distribution in RKO A, and HCT116 B. C and D, are the cell cycle–related proteins detected by the WB experiment. *P < .05, **P < .01 (compared with the control group)