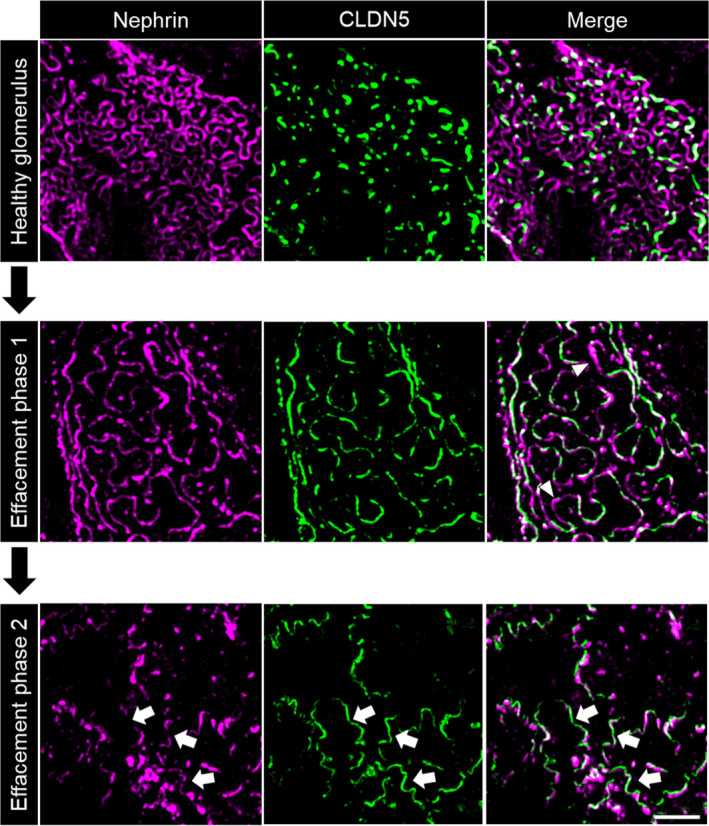
FIGURE 5.

Evolution of CLDN5 up‐regulation in 3D‐SIM images of human glomeruli. Compared with healthy glomeruli, in phase 1 of effacement CLDN5 was up‐regulated following the nephrin‐positive FS. Nephrin is continuous and effaced areas without CLDN5 could be observed (arrowheads). With progressing effacement (phase 2), nephrin became discontinuous and CLDN5‐positive, but nephrin‐negative areas were found (arrows), here shown in FSGS biopsies. The scale bar indicates 2 µm
