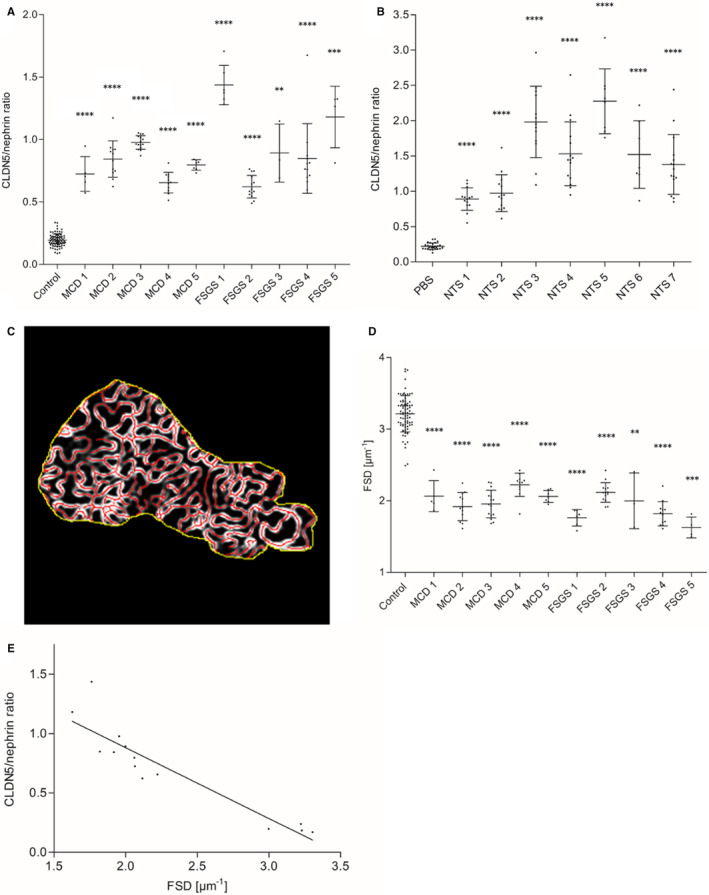
FIGURE 7.

A, Results of CLDN5/nephrin ratio measurement showed a significantly higher CLDN5/nephrin ratio in MCD (n = 5) and FSGS (n = 5) biopsies compared with human nephrectomy samples as controls (n = 4). Panel B, shows a significantly higher CLDN5/nephrin ratio in NTS‐injected mice (n = 7) compared with PBS‐injected control mice (n = 3). In A and B, every measuring point represents the glomerular mean of at least 20 measured areas. Error bars show standard deviation. ****P < .0001, ***P < .001, **P < .01, Mann‐Whitney U test. C, Measurement of the filtration slit density (FSD) in MCD (n = 5) and FSGS (n = 5) compared with human nephrectomy samples as controls (n = 4) with PEMP. D, MCD and FSGS biopsies showed a significantly reduced FSD compared with controls. Every measuring point represents the glomerular mean of at least 20 measured areas. Error bars show standard deviation. ****P < .0001, ***P < .001, **P < .01, Mann‐Whitney U test. E, Correlation analysis of CLDN5/nephrin ratio and FSD in MCD (n = 5), FSGS (n = 5) and controls (n = 4) showed a highly significant correlation of CLDN5/nephrin ratio and FSD. CLDN5 expression increased with increasing foot process effacement. Every measuring point represents the average for the whole sample. r = −.952, P < .0001, R 2=.906, Spearman's correlation
