
FIGURE 2.
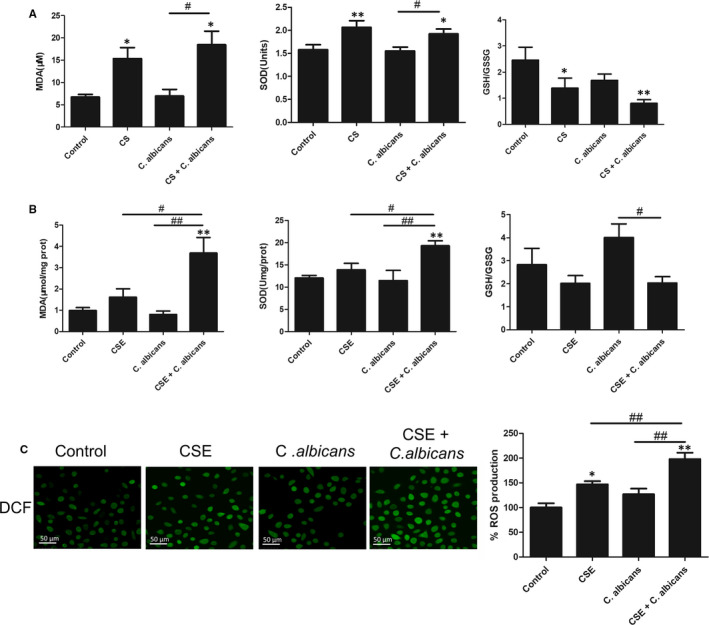
Biomarkers of oxidative injury in oral mucosa fungal infection. A, MDA level, SOD activity and GSH/GSSG ratio in the serum of the rat model were detected by commercial kits. B, The corresponding indexes in Leuk1 cells were also measured. The MDA levels and SOD activity increased, while GSH/GSSG levels decreased after CS or CSE treatment in vivo and in vitro. C, Smoking induces ROS production in Leuk1 cells. Left: representative micrographs show that CSE treatment increases ROS production, as shown by DCF (in green; original magnification: 400×, scale bar: 50 μm). Right: fluorescence intensity measured using a fluorescence microplate system. Each bar represents the mean ± SD. *P < .05, **P < .01, compared with control. # P < .05, ## P < .01, compared with the Candida albicans group. CS: cigarette smoke; CSE: cigarette smoke extract; C. albicans: Candida albicans; ROS: reactive oxygen species; MDA: malondialdehyde; SOD: superoxide dismutase; GSH/GSSG: reduced glutathione/oxidized glutathione; DCF: 2′,7′‐dichlorofluorescein