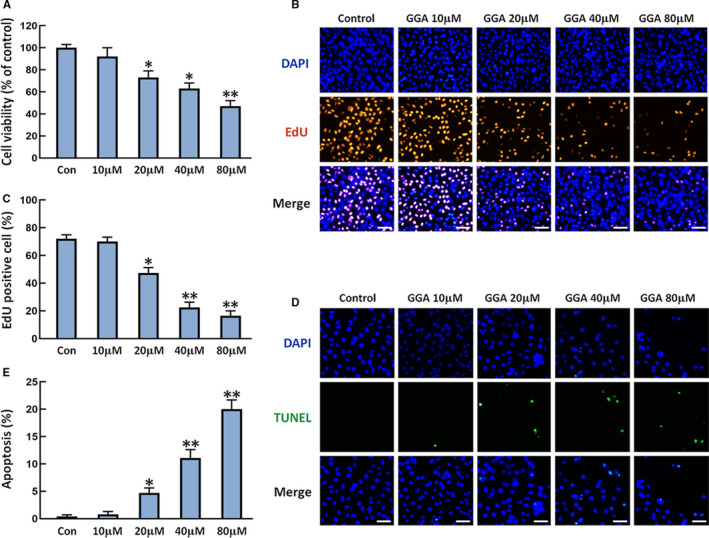
FIGURE 1.

Effects of GGA on the proliferation and apoptosis of U‐2 OS cells. U‐2 OS cells were treated with GGA for 24 h. A, CCK‐8 assay detection of U‐2 OS cell viability. B, EdU staining for cell proliferation. Scale bar = 100 µm. C, Quantification of EdU‐positive cells. D, Representative images of TUNEL assay (green) and total nuclear staining with DAPI (blue). Scale bar = 100 µm. E, the numbers of apoptotic cells were counted in five randomly selected fields for each sample based on the TUNEL images. n = 3. *P < 0.05 and **P < 0.01 vs the control (Con) group
