FIGURE 2.

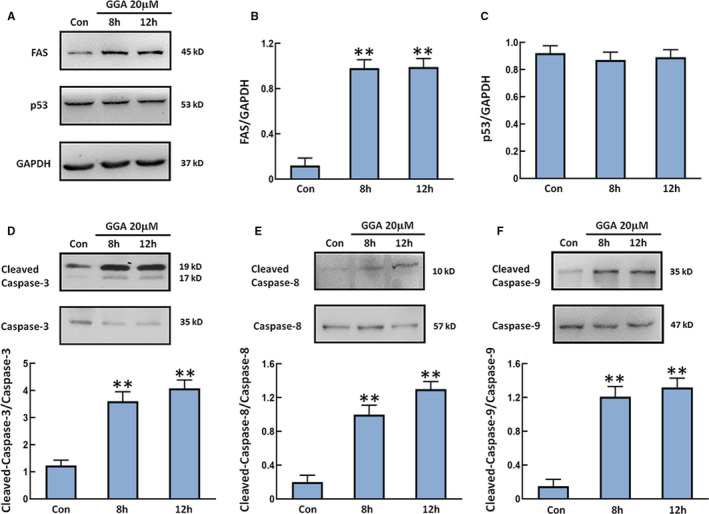
The expression of FAS and p53 and activation of caspase‐3, caspase‐8, caspase‐9 in cells. U‐2 OS cells were treated with 20 µM GGA for 8 and 12 h followed by lysis in RIPA buffer. A, Western blot detection of the expression of FAS and p53. B and C, Quantification of the expression of FAS and p53. D‐F, The levels of cleaved caspase‐3/caspase‐3, cleaved caspase‐8/caspase‐8 and cleaved caspase‐9/caspase‐9 were examined by Western blot and plotted in the panels under the images. n = 3. **P < 0.01 vs the Con group
