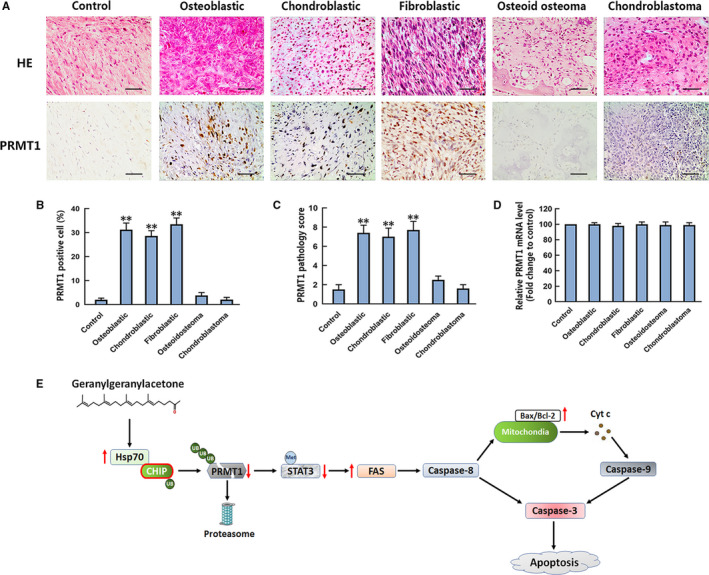
FIGURE 7.

Evaluation of PRMT1 protein and mRNA levels in OS and two benign bone tumours. A, Representative 20× images of H&E staining (upper row) and anti‐PRMT1 antibody staining (bottom row) of control, osteoblastic, chondroblastic, fibroblastic OS, osteoid osteoma and chondroblastoma. Scale bar =200 µm. B, The percentages of PRMT1‐positive cells were calculated based on five randomly selected fields in the stained control, OS and benign bone tumour tissues. C, The pathology scores of PRMT1‐positive staining in the control and bone tumour tissues. The means of the scores of five randomly selected fields of tissues were used for plotting. D, The mRNA level of PRMT1 in control and tumours tissues was detected by qPCR assay. The mRNA analysis result is expressed as the fold increase over control. n = 8‐22. E, Signalling mechanisms of GGA‐induced U‐2 OS cell apoptosis. UB, ubiquitination. Met, methylation. **P < 0.01 vs the control group
