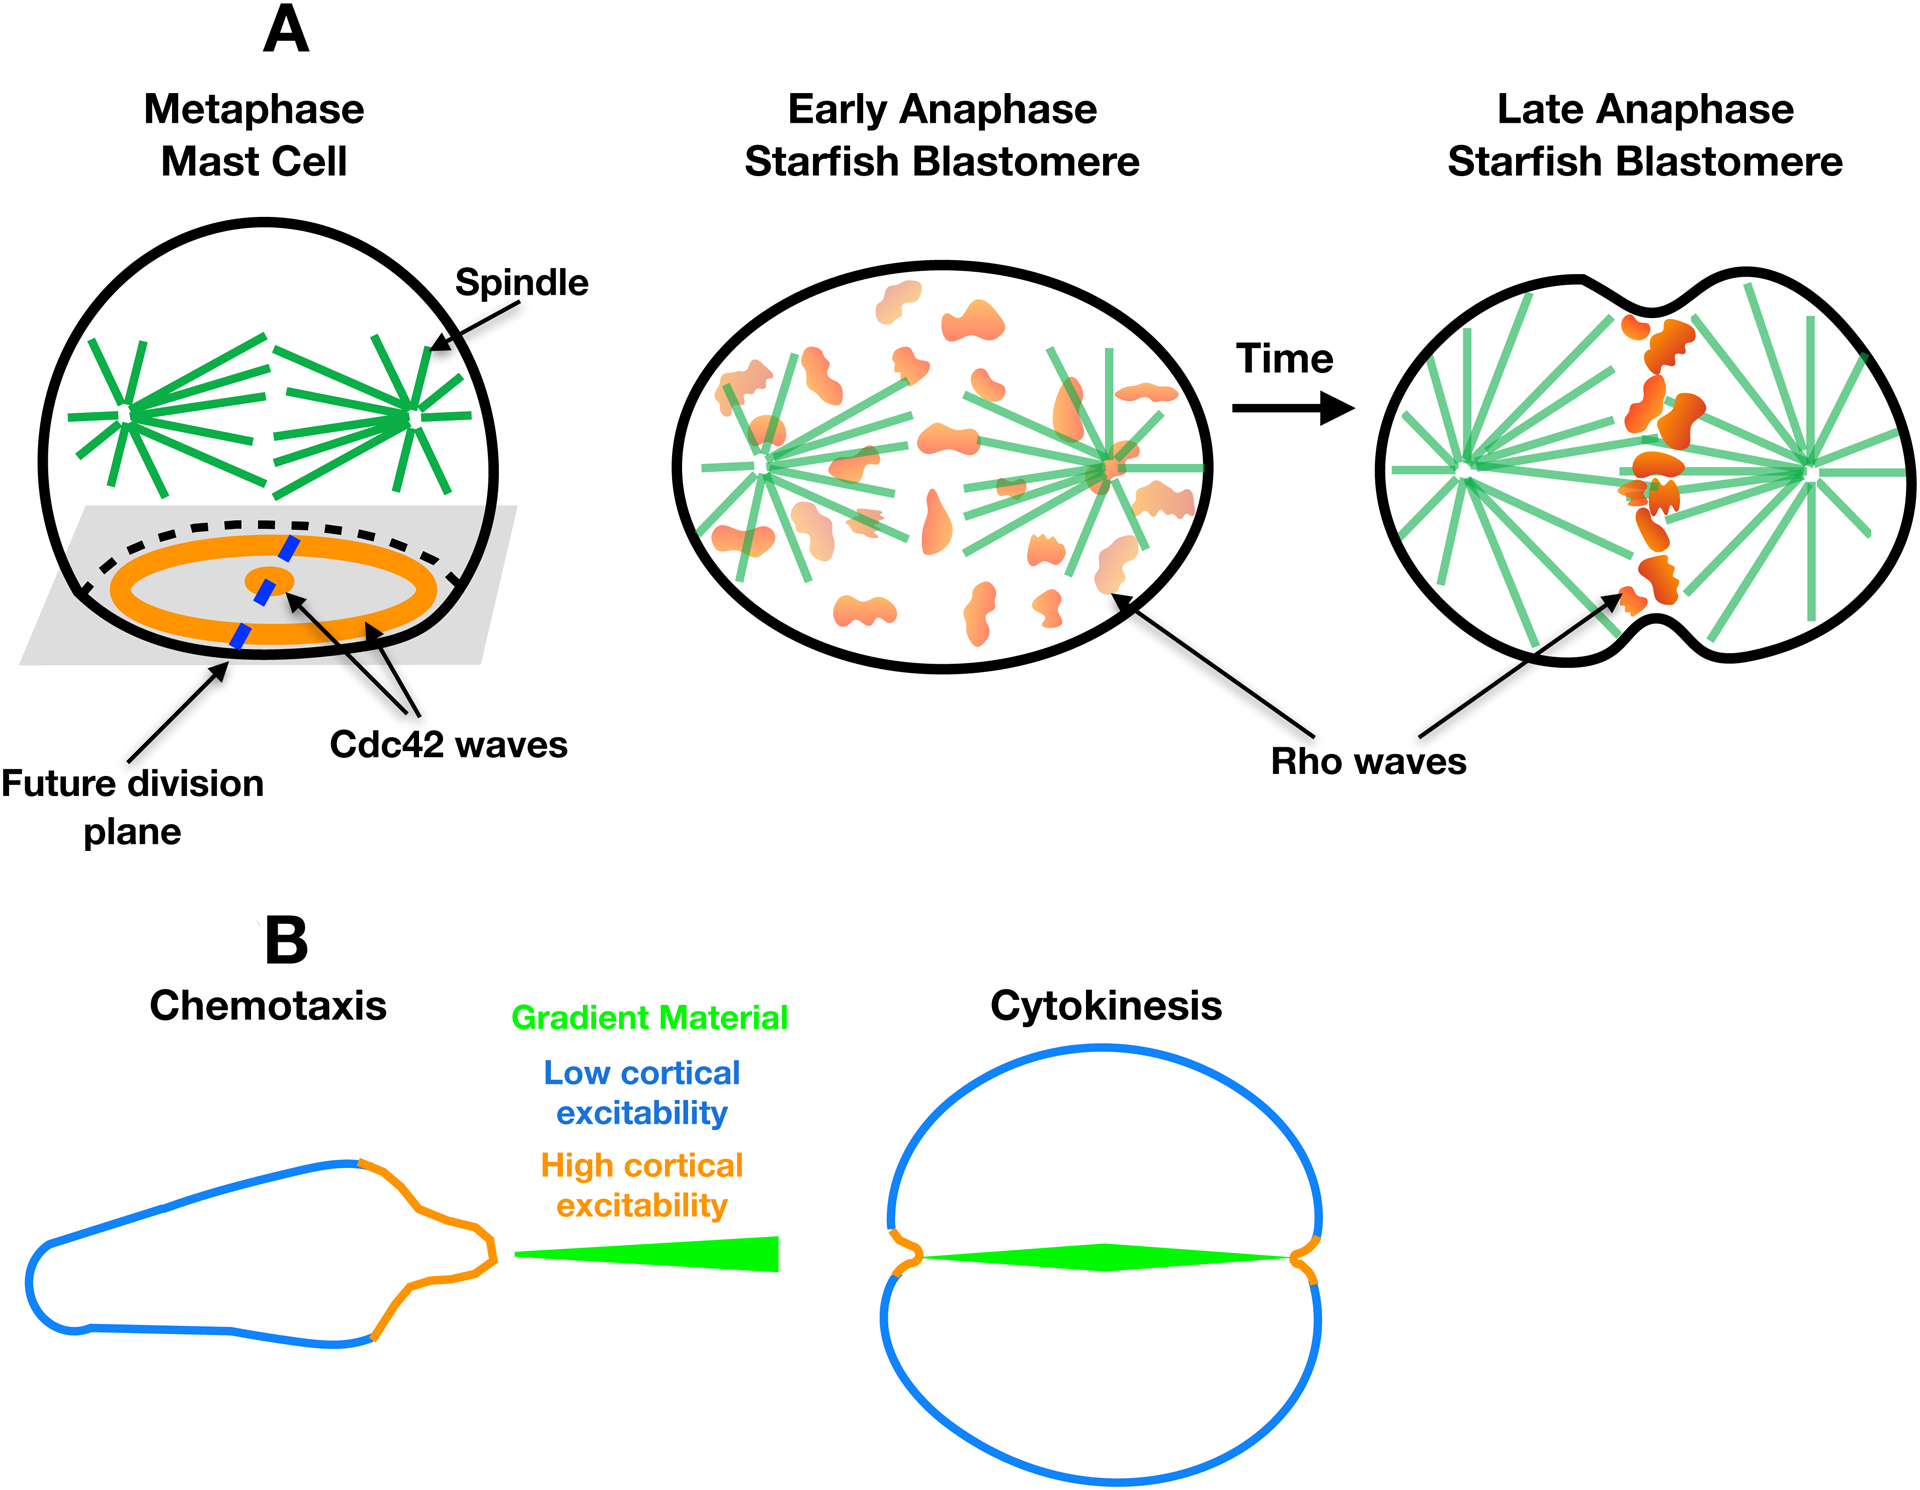
Figure 3. Cortical excitability in cell division.

(A) Wave organization in mitotic cells. Left: Schematic diagram of a metaphase mast cell showing the spatial relationships of the Cdc42 waves (orange), the mitotic spindle (green), and the future division plane (dashed blue line). Right: diagram of starfish blastomere showing changes in Rho waves (orange) between early and late anaphase. Over time, the waves are lost from polar cortical regions, while becoming concentrated and amplified (darker orange) at the equatorial cortex. (B) Cytokinesis as inverted chemotaxis. Left: Chemotaxing cell migrating up an external chemotactic gradient (green). As in Figure 2, excitability is high (orange) where the cortex faces the gradient and low (blue) elsewhere. Right: Cell undergoing cytokinesis and ingressing up an internal chemotactic gradient (green). Excitability is high (orange) where the cortex faces the gradient and low (blue) elsewhere.
