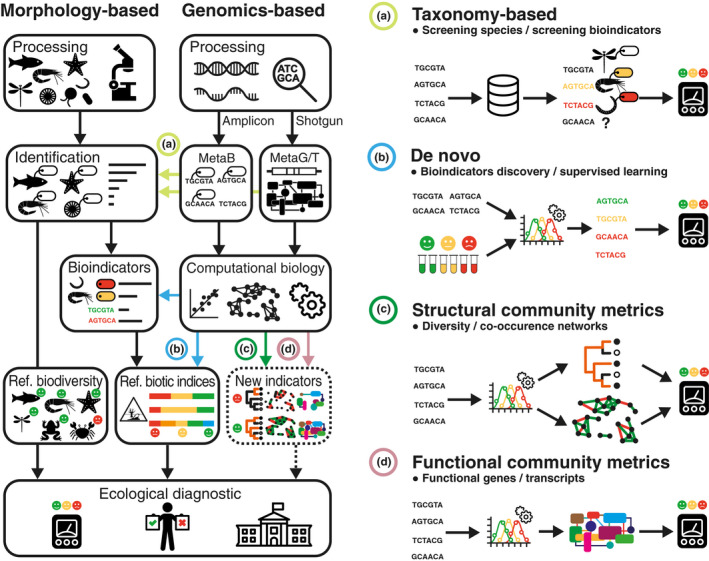
FIGURE 1.

Overview of the current methodology for the monitoring of ecosystems, that relies mostly on the morphological identification of biodiversity and/or bioindicators of anthropogenic impacts. Ecological diagnostics are performed based on reference biodiversity or on reference biotic indices for a given ecosystem. The development of environmental genomics methodologies has led to the proposition of multiple implementation strategies that can intervene at different levels of the monitoring workflow, to produce an ecological diagnostic. Green colours and smileys within boxes indicate reference biodiversity and "good" or “high” ecological status while red colours and smileys represent nonreference biodiversity and “poor” ecological status (i.e., impacted environments) Green colours and smileys within boxes indicate reference biodiversity and "good" or “high” ecological status while red colours and smileys represent nonreference biodiversity and “poor” ecological status (i.e., impacted environments). The colours on tags besides organisms or sequences indicate their bioindication value (red: indicator of impact, yellow: indicator of intermediate status, green: indicator of good status). In this review paper, these strategies have been grouped into four broad categories: (a) Taxonomy‐based analyses focused on identification of known bioindicators or described taxa; (b) De novo bioindicator analyses; (c) Structural community metrics including inferred ecological networks; and (d) Functional community metrics (metagenomics or metatranscriptomics)
