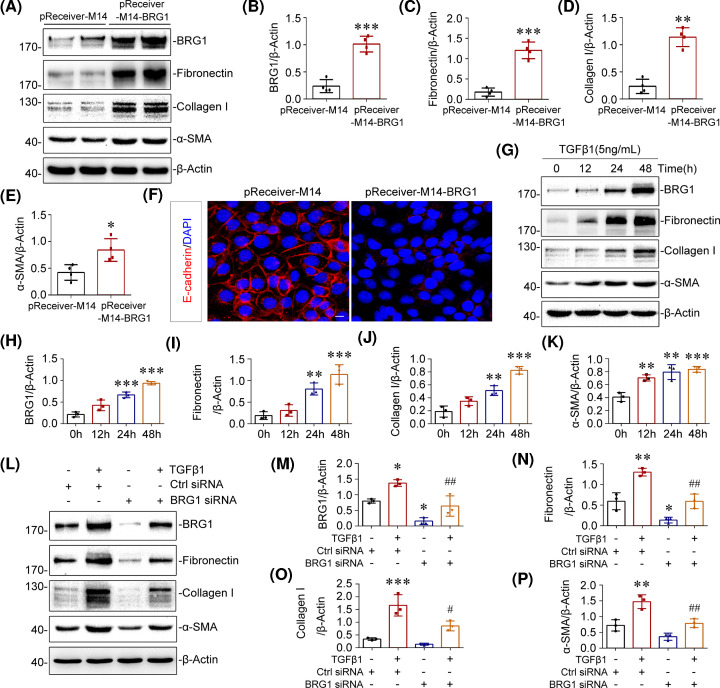
Figure 5. BRG1 promotes fibrotic responses in renal tubular epithelial cells.
(A–E) Western blot analysis showed that overexpression of BRG1 induced the protein levels of fibronectin, collagen I, and α-SMA in vitro. mTECs were transfected with control vector (pReceiver-M14) or BRG1 overexpression plasmid (pReceiver-M14-BRG1) for 48 h. Representative Western blot (A) and quantitative data on BRG1 (B), fibronectin (C), collagen I (D), and α-SMA (E) are presented. *P<0.05, **P<0.01, ***P<0.001 versus pReceiver-M14 group (n=4). (F) Representative immunofluorescent micrographs of E-cadherin (red) merged with DAPI (blue) in mTECs after transfection with pReceiver-M14 or pReceiver-M14-BRG1 for 48 h. Scale bar, 10 μm. (G–K) Western blot analysis showed that TGF-β1 time-dependently induced the expression of BRG1, fibronectin, collagen I, and α-SMA in vitro. mTECs were treated with TGF-β1 (5 ng/ml) for the indicated time period. Representative Western blot (G) and quantitative data on the relative abundance of BRG1 (H), fibronectin (I), collagen I (J), and α-SMA (K) proteins in four groups are presented. **P<0.01, ***P<0.001 versus control groups (n=3). (L–P) Western blot analysis showed that knockdown of BRG1 blocked TGF-β1-induced fibronectin, collagen I, and α-SMA proteins expression. mTECs were transfected with control (Ctrl siRNA) or BRG1-specific siRNA (BRG1 siRNA), followed by stimulation with TGF-β1 (5 ng/ml) for 48 h. Representative Western blot (L) and quantitative data on the relative abundance of BRG1 (M), fibronectin (N), collagen I (O), and α-SMA (P) proteins in different groups are presented. *P<0.05, **P<0.01, ***P<0.001 versus control group; #P<0.05, ##P<0.05 versus Ctrl siRNA in the presence of TGF-β1 (n=3).

